
Create a Robust Logstash configuration
The past week I was going over an ELK configuration for log processing at a customer. Like always, there were some things to improve. Before diving into the configuration, I wanted to have a look at a few options that Logstash provides these days. I started a small experiment to investigate using pipelines, and persistent queues. To make it run on my laptop I decided to have a look at a docker-compose configuration. In this blog post, you will learn about some of my findings to make this experiment work.
Context of the experiment
The main goal for the experiment is to make a more robust Logstash configuration for a project with a lot of steps in the filter part and some performance issues on the UDP input. Using the most recent version of Logstash (7.6 at the time of writing), I want to implement an example using multiple pipelines, one for the input of UDP messages, one for the output to elasticsearch using multiple indexes, and more than one for the filter part of different paths. The sub-goal for the experiment is gaining experience with Elastic X-Pack features that are available through Kibana concerning pipeline monitoring.
Used websites and libraries
The most interesting resource for this experiment was this GitHub repository: “https://github.com/deviantony/docker-elk“. This gave me a jump start to configure the complete ELK stack. Of course, it was not completely what I needed, but with some small changes, I could easily work with it. Other resources are the documentation pages of Elastic:
- https://www.elastic.co/guide/en/logstash/current/pipeline-to-pipeline.html
- https://www.elastic.co/guide/en/logstash/current/persistent-queues.html
- https://www.elastic.co/guide/en/logstash/current/tuning-logstash.html
Changes to the default docker-compose
One of the things with Docker and especially with docker-compose scripts is that every script you open seems to be different. I tried to stick as much as possible to the notations of the original author. One of the things I like is adding a volume to a local folder for the Elasticsearch data folder. This enables you to keep the data after a restart. Therefore I added this to the volumes part of elasticsearch config.
docker-compose.yml
- type: bind
   source: ./elasticsearch/data
   target: /usr/share/elasticsearch/data
The Logstash part contains more changes, therefore I post it complete. I added the pipelines.yml, the pipelines folder and the data folder for the persistent queue data. I also added the port for http input connector and made the reloading of config work by adding the command part.
docker-compose.yml
  logstash:
    build:
      context: logstash/
      args:
        ELK_VERSION: $ELK_VERSION
    volumes:
      - type: bind
        source: ./logstash/config/logstash.yml
        target: /usr/share/logstash/config/logstash.yml
        read_only: true
      - type: bind
        source: ./logstash/config/pipelines.yml
        target: /usr/share/logstash/config/pipelines.yml
        read_only: true
      - type: bind
        source: ./logstash/pipeline
        target: /usr/share/logstash/pipeline
        read_only: true
      - type: bind
        source: ./logstash/data
        target: /var/lib/logstash/data
    ports:
      - "9101:5000/tcp"
      - "9101:5000/udp"
      - "8003:8003"
      - "9600:9600"
    command: --config.reload.automatic
    environment:
      LS_JAVA_OPTS: "-Xmx1g -Xms1g"
    networks:
      - elk
    depends_on:
      - elasticsearch
Using Persistent queues
An interesting option when the number of records coming in fluctuates a lot is using a persistent queue between your input and the filter part. Especially useful when dealing with a UDP input that just tosses the overflow messages, having a queue that writes messages to a file that cannot be handled immediately. Configuring the queue type is as easy as adding the queue.type and path.queue options through the logstash.yml file. In our case, we configure the queue.type per pipeline. But the path is configured in the logstash.yml file to be: “/var/lib/logstash/data/queue”. Yes the path as configured in the docker-compose.yml file. In the next part, we are going to configure the pipelines.
Configuring the pipelines
Before diving into the code, there are a few things to take note of. First, be sure to configure the pipelines.yml file in your docker-compose. If you forget this. all pipeline files in the pipeline folder are automatically loaded and everything becomes a mess. In the pipelines.yml file we configure the different pipelines. The main pipeline contains the input through UDP and http. The first pipeline splits the name by a space character. If the last name is Coenradie, the message is sent to the coenradie pipeline. In all other cases the message is sent to the other pipeline. Both these pipelines set the field index_group. Which is used in the final pipeline to be sent to elasticsearch. The name of the index is taken from the field index_group. The code blocks below show the different pipelines.
pipelines.yml
- pipeline.id: main_pipeline
  path.config: "/usr/share/logstash/pipeline/main.pipeline"
  queue.type: persisted
- pipeline.id: elasticsearch_pipeline
  path.config: "/usr/share/logstash/pipeline/elasticoutput.pipeline"
- pipeline.id: coenradie_pipeline
  path.config: "/usr/share/logstash/pipeline/coenradie.pipeline"
- pipeline.id: other_pipeline
  path.config: "/usr/share/logstash/pipeline/other.pipeline"
main.pipeline
input {
	http {
		id => "receiveMessagesHttp"
		port => 8003
		codec => "json"
	}

	tcp {
		id => "receiveMessagesTcp"
		port => 5000
		codec => "json"
	}

}
filter {
	mutate {
		lowercase => [ "name" ]
	}
	grok {
		id => "splitName"
		match => { "name" => "%{WORD:firstname} %{WORD:lastname}" }
	}
}
output {
  	if [lastname] == "coenradie" {
		pipeline {
			id => "sendToCoenradie"
			send_to => coenradie_pipeline
		}
	} else {
		pipeline {
			id => "sendToOther"
			send_to => other_pipeline
		}
	}
}
coenradie.pipeline
input {
	pipeline {
		id => "readCoenradie"
		address => coenradie_pipeline
	}

}
filter {
	mutate {
		id => "addIndexGroupCoenradie"
		add_field => {"index_group" => "coenradiegroup"}
	}

}
output {
	pipeline {
		id => "fromCoenradieToElastic"
		send_to => elasticsearch_pipeline
	}
}
other.pipeline
input {
	pipeline {
		id => "readOther"
		address => other_pipeline
	}
}
filter {
	mutate {
		id => "addIndexGroupOther"
		add_field => { "index_group" => "othergroup" }
	}
}
output {
	pipeline {
		id => "fromOtherToElastic"
		send_to => elasticsearch_pipeline
	}
}
elasticoutput.pipeline
input {
	pipeline {
		address => elasticsearch_pipeline
	}
}

output {
	elasticsearch {
		hosts => "elasticsearch:9200"
		index => "%{index_group}-%{+YYYY.MM.dd}"
		user => "elastic"
		password => "changeme"
	}
}
That’s it, now you can run the sample. Send a few messages and go to the special monitoring board in Kibana to see the messages coming in. Open de url http://localhost:5601, login with elastic – changeme. Open de monitoring app (almost at the bottom). Of course you can also use the Kibana console to inspect the indexes. If you are not sure how to send messages using curl or nc on the mac. Be sure to check the last code block. The code: https://github.com/jettro/docker-elk-blog
$ echo "{\"name\":\"Jettro Coenradie\"}" | nc 127.0.0.1 9101
$ curl -XPOST "http://localhost:8003" -H 'Content-Type: application/json' -d'{  "name": "Byron Voorbach"}'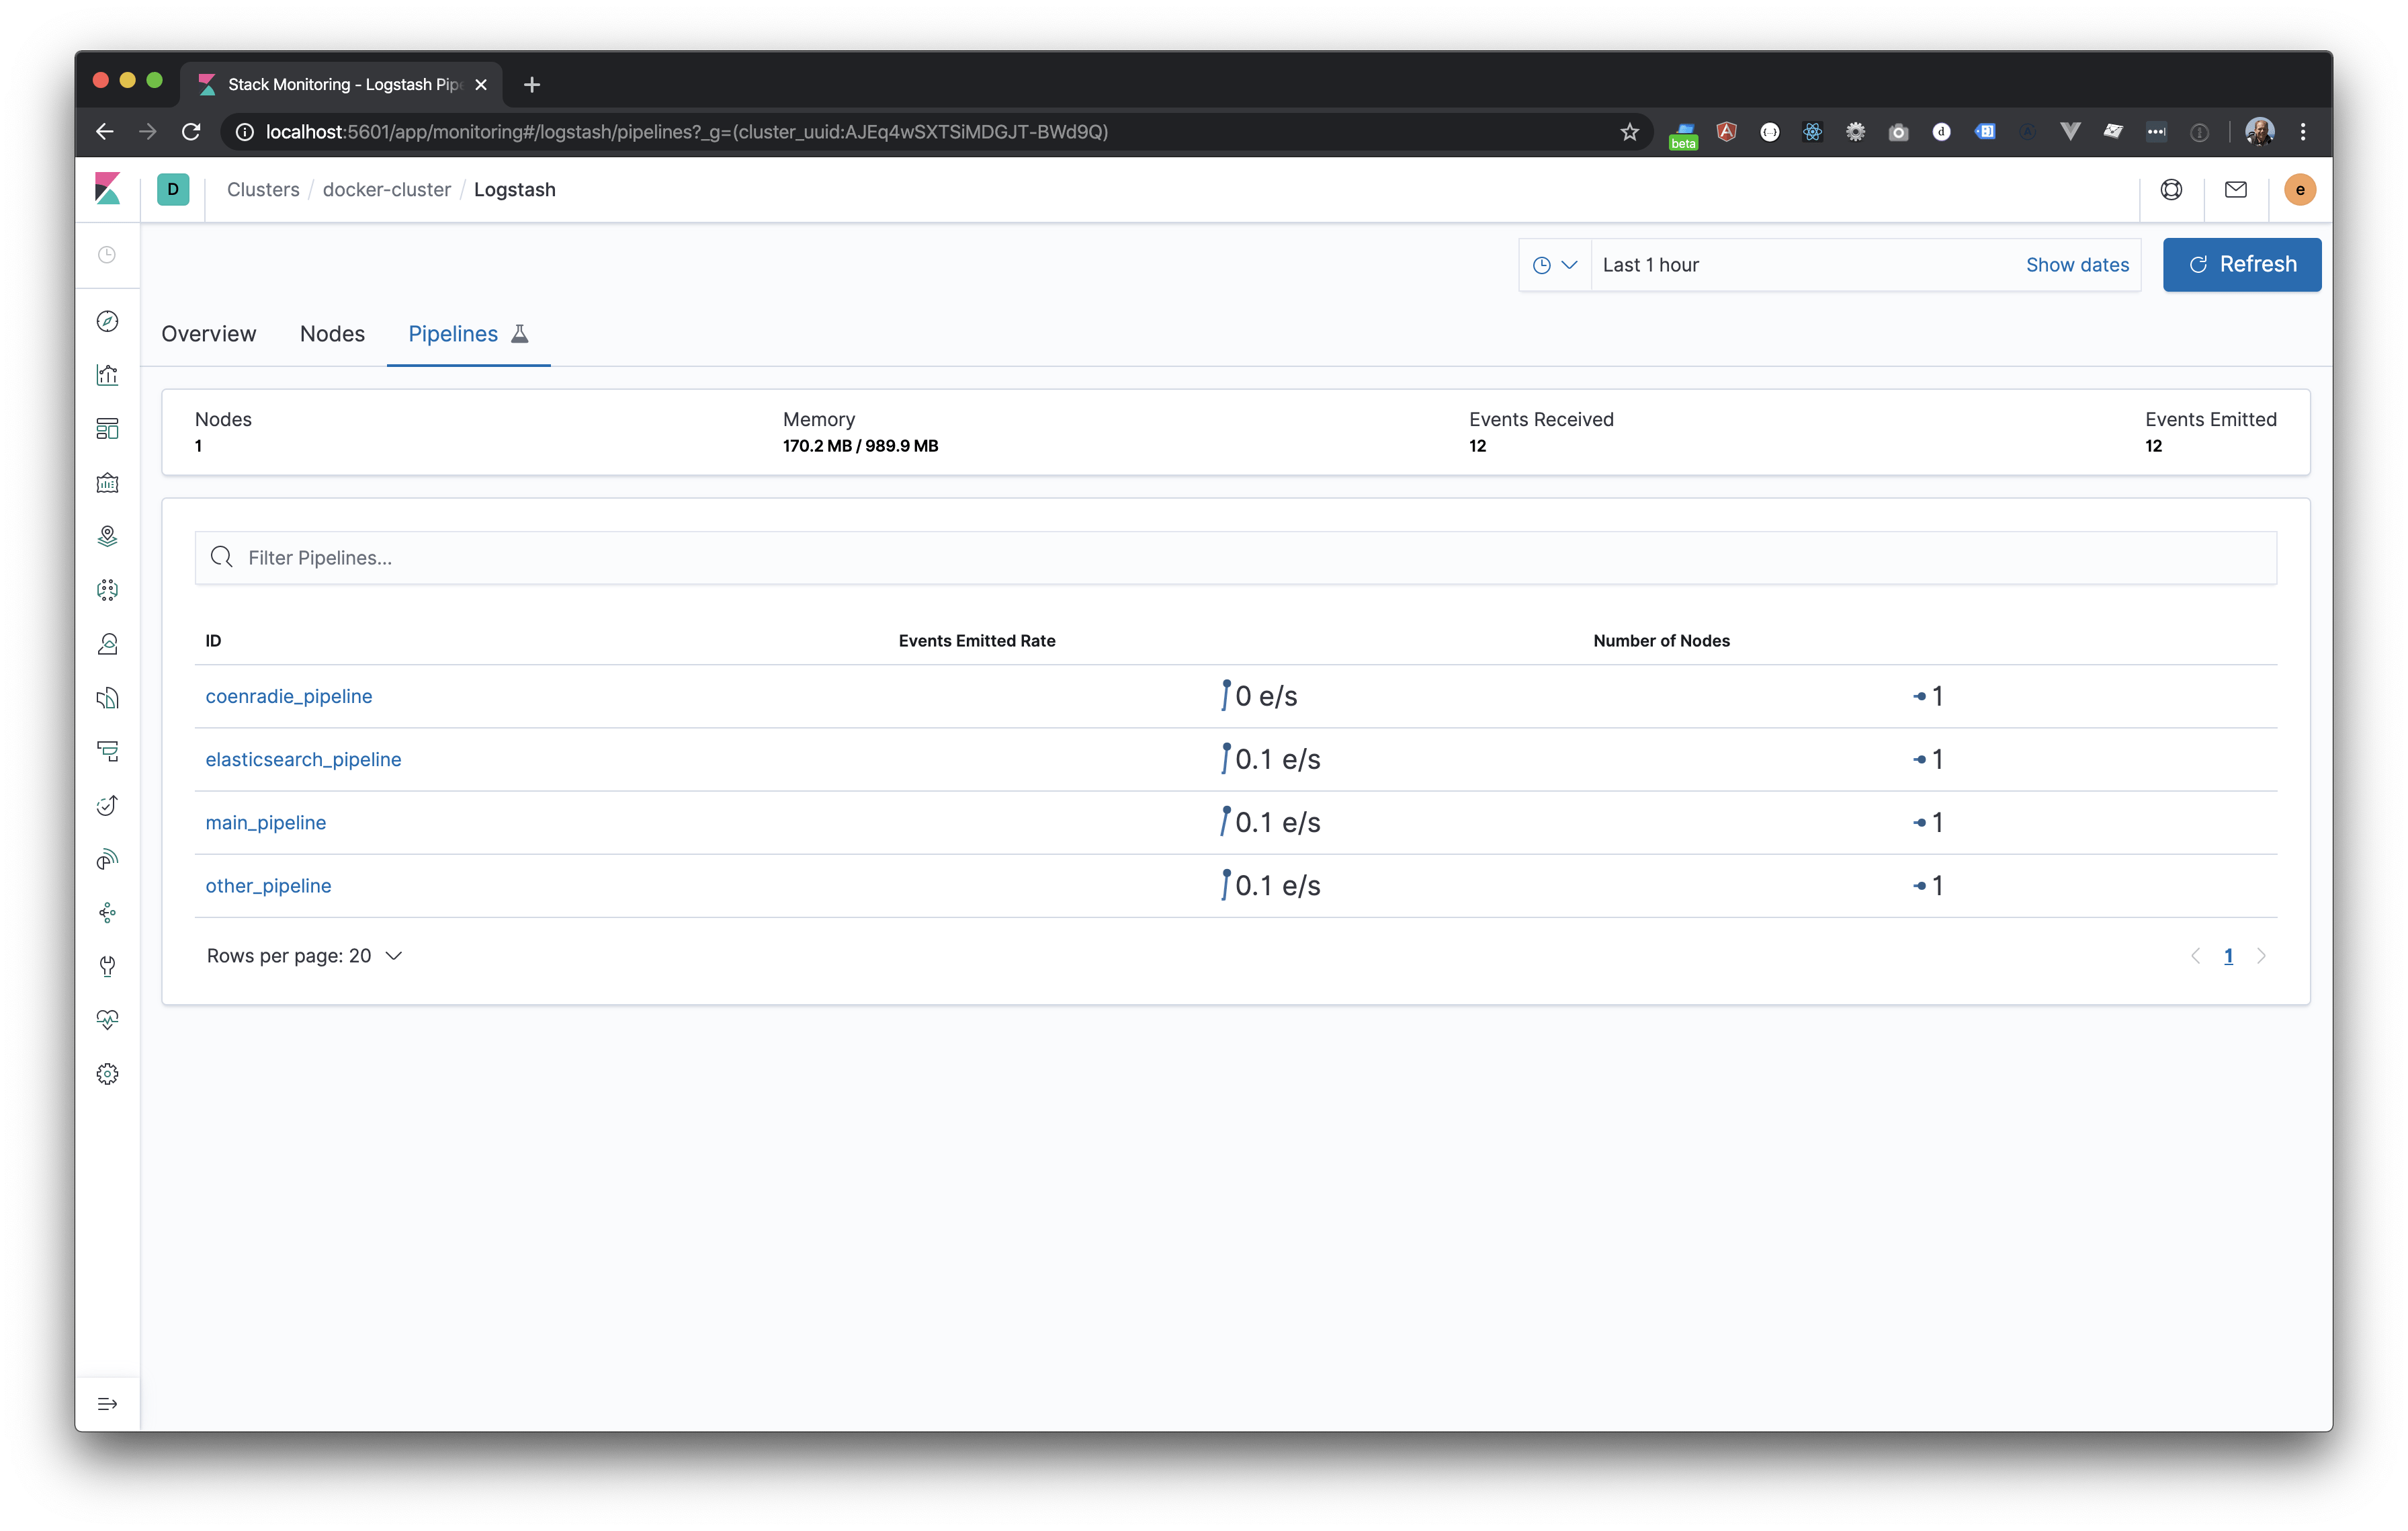
Meer weten over wat wij doen?
We denken graag met je mee. Stuur ons een bericht.