
How to improve Observability using the Elastic Stack
In the fast-paced world of modern software applications, ensuring a smooth and reliable user experience is paramount. Currently, I am working on improving the observability of the applications of a customer, using the Elastic stack. In this blog, I take you along with me on that journey.
By improving observability, the customer hopes to identify and resolve application issues more quickly, ensuring a smooth and reliable user experience for their customers. In this blog, you read about what observability is and how we can achieve it by implementing the Elastic Stack. This blog post is part of a series in which we explore a range of use cases, each complemented by an appropriate solution.
Next in the series on Observability using Elastic Stack:
Throughout this series, I spotlight various use cases and challenges to demonstrate how you can effectively leverage Elasticsearch within your business for better observability. Key topics that I dive into include:
- Getting started with the ELK Stack and Docker
- Managing the index life cycle
- Creating Kibana dashboards
- Implementing alerting systems
- Employing monitoring techniques with Application Performance Monitoring (APM)
- Securing Your Elastic Stack: Tips for Optimal Security
- Leveraging Machine Learning Features in the Elastic Stack
Observability: What Does It Mean?
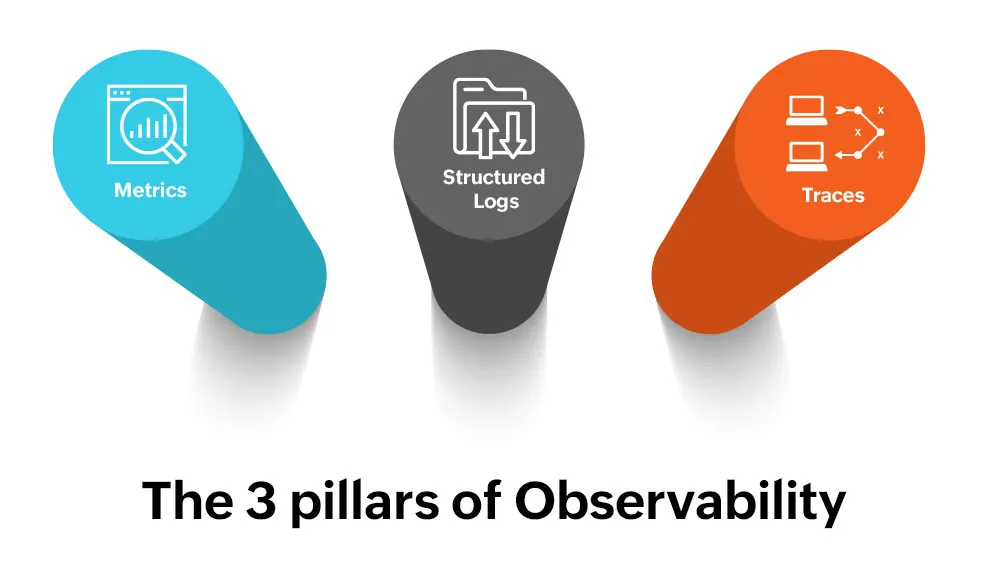
The ability to monitor and understand the behavior of a system through the collection and analysis of metrics, logs, and tracing data. That is a general definition of observability. Usually, observability is divided into three pillars. These pillars of observability refer to the three critical aspects of monitoring and understanding the behavior of a system: metrics, logging, and tracing.
- Metrics are numerical values that describe the performance and behavior of a system. They can be used to monitor the health and capacity of a system, as well as identify trends and patterns over time.
- Logging is the process of recording events and messages generated by a system. Logs can track a system’s behavior, identify issues, and provide context for debugging and troubleshooting.
- Tracing is following a request or operation flow through a distributed system. Tracing can help identify bottlenecks and performance issues, as well as provide a complete view of how a system is functioning.
Together, these three pillars of observability provide a comprehensive understanding of the behavior and performance of a system. They are essential for ensuring the reliability and stability of modern software applications. The Elastic Stack is a powerful tool that can help with application observability by providing a central location for storing, analyzing, and visualizing various data types. Now, let’s dive deeper into understanding this powerful resource.
The Elastic Stack: A Closer Look
The Elastic Stack, formerly known as the ELK Stack, is a robust suite of open-source software tools designed to take data from any source, in any format. It enables users to search, analyze, and visualize that data in real time. The Elastic Stack is composed of four main components: Elasticsearch, Logstash, Kibana, and Beats.

- Elasticsearch is the heart of the Elastic Stack. It is a distributed, RESTful search and analytics engine capable of handling a wide variety of data types, including textual, numerical, geospatial, structured, and unstructured. You can use Elasticsearch for log and event data storage, but also for full-text search, distributed search, and analytics.
- Logstash is a server-side data processing pipeline that accepts data from multiple sources simultaneously, transforms it, and then sends it to a “stash” like Elasticsearch. It’s extremely useful in gathering logging data and other event data from different sources and provides filters to transform the data.
- Kibana is the visualization layer of the Elastic Stack. It allows you to explore your Elasticsearch log data through a web interface, and build dashboards that highlight the relationships between your data over time. Kibana also allows for the management of Elasticsearch indices and the manipulation of the data contained within.
- Beats is a platform for single-purpose data shippers. They install as lightweight agents and send data from hundreds or thousands of machines to Logstash or Elasticsearch. Each Beat is designed for a specific data type, such as system metrics, network metrics, or log files.
Together, these components provide a flexible, scalable, and effective way to collect, process, store, search, analyze, and visualize data in real time. Therefore, they are invaluable in improving observability within systems.
Next Up: Hands-On with Elastic
The Elastic Stack offers a powerful suite of tools that provide valuable insights into the behavior and performance of your systems, enhancing observability and consequently, improving operational efficiency. But the true power of these tools lies not only in understanding them conceptually, but also in employing them hands-on. So, what’s the next step in our journey? It’s time to roll up our sleeves and get practical. We explore how to implement each component and leverage their combined capabilities for effective system observability. Get ready for an insightful and dynamic journey — you don’t want to miss it!
If you’re an experienced reader not planning to follow this series to the end, we’d love to hear from you as well! How have you harnessed the power of the Elastic Stack to enhance observability in your projects? Share your insights and stories in the comments below. Your experience could be the inspiration or solution someone else is seeking!
Want to know more about what we do?
We are your dedicated partner. Reach out to us.