
From Code to Cloud: A Hands-On Guide to Azure Container Apps
As a cloud professional, I constantly seek ways to streamline application delivery while reducing operational overhead. Whether you’re building APIs, microservices, or event-driven backends, choosing the right platform can significantly impact speed to market and maintainability.
Introducing Azure Container Apps (ACA) — a fully managed, serverless platform designed specifically for running containerized workloads without the complexity of orchestrating and managing Kubernetes infrastructure. Built on top of Kubernetes and powered by open-source technologies like Dapr and KEDA (Kubernetes Event Driven Autoscaling), ACA offers the best of both worlds: the power and flexibility of containers with the simplicity and developer focus of a Platform-as-a-Service (PaaS).
I’ll walk you through the ACA experience from code to cloud in this blog. We’ll cover everything from setting up your environment and deploying container images to managing revisions, securing access with VNets and Private Link, and implementing advanced monitoring with Azure Monitor and Application Insights. We’ll even explore modern deployment strategies like Blue/Green and dive into distributed tracing with Dapr and OpenTelemetry.
Whether you’re coming from an Azure Kubernetes Services (AKS) background or exploring ACA for greenfield projects, this guide will give you hands-on insight into how ACA fits into your cloud architecture toolbox.
· What is Azure Container Apps?
· Key Features
· Azure Container Apps vs Azure Kubernetes Service: Which One to Choose?
· Getting Started with Azure Container Apps
· Managing and Monitoring Azure Container Apps
· VNet Integration and Private Link for Secure Access
· Final Thoughts
What is Azure Container Apps?
Azure Container Apps is a fully managed serverless platform that enables developers to run containerized applications without managing the underlying infrastructure. It is designed for microservices, event-driven applications, and background tasks, allowing you to focus on writing code rather than handling orchestration details. Built on Kubernetes, ACA leverages open-source projects like Dapr for microservices and KEDA for event-driven scaling, making it a versatile solution for cloud-native app development.
Key Features
– Serverless Scaling: Automatically scales applications based on HTTP traffic, events, or custom metrics. Supports scaling down to zero when no activity is detected, reducing costs.
– Built-in Ingress and Load Balancing: Provides out-of-the-box support for HTTPS ingress and load balancing across app revisions.
– Environment Scoping: Container Apps are deployed within an environment that can span virtual networks, providing network isolation and scalability.
– Integrated Open-Source Technologies: Supports Dapr for building microservices, KEDA for autoscaling, and Envoy for ingress.
– Support for CI/CD Pipelines: Easily integrates with GitHub Actions or Azure DevOps for streamlined build and deployment workflows.
– Built-In Secret Management: Use Azure Key Vault or environment variables to manage application secrets securely.
Azure Container Apps architecture

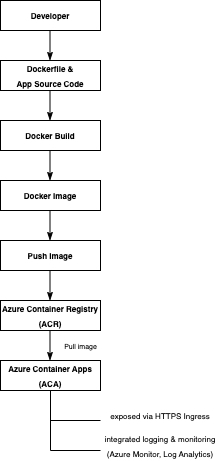
How It Works
- Deployment: You deploy container images (from ACR, Docker Hub, etc.) to ACA via Azure CLI, ARM/Bicep, Terraform, or GitHub Actions.
- Runtime: ACA runs your container in a managed environment. You don’t manage any VMs, nodes, or Kubernetes resources.
- Scaling: KEDA automatically scales your app in and out based on workload. It supports scale to zero and back to n instances.
- Ingress: Envoy provides HTTPS ingress and routes traffic to the correct revision of your app (ACA uses a revision-based deployment model).
- Networking: You can enable internal-only access, integrate with VNets, or expose the app publicly.
- Observability: Logs and metrics are collected via Azure Monitor and Application Insights (optional).
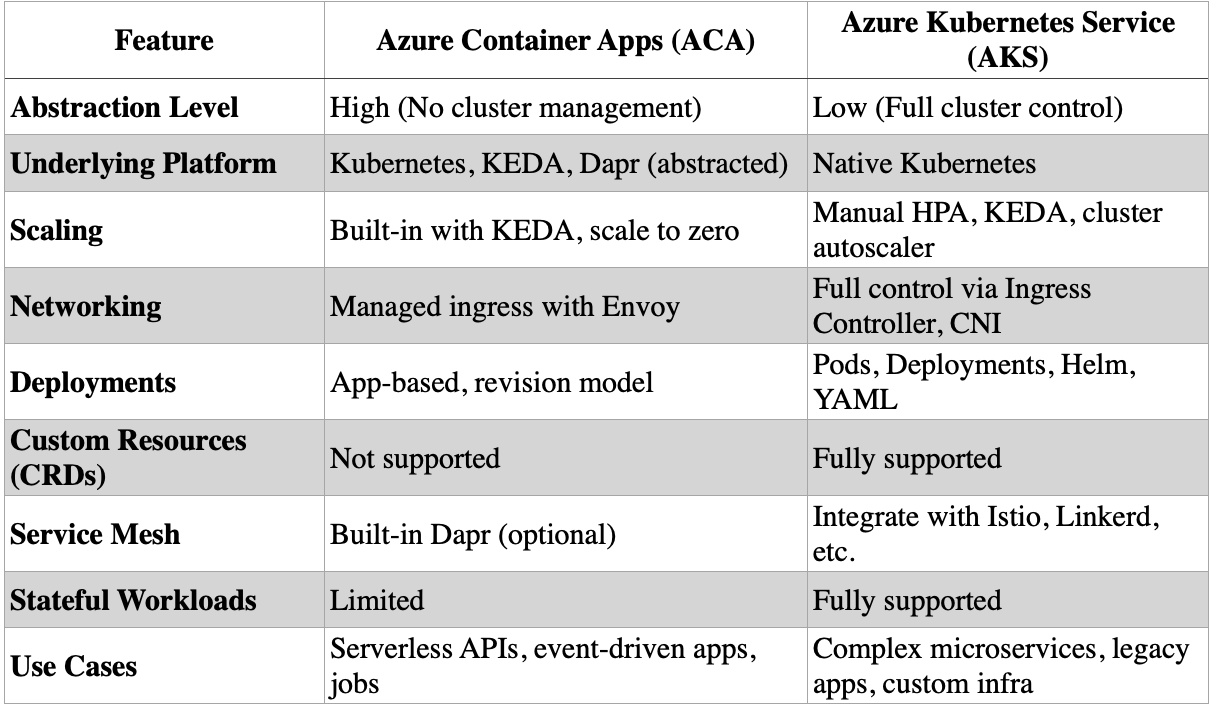
Azure Container Apps vs Azure Kubernetes Service: Which One to Choose?
When building containerized applications on Azure, two popular options are Azure Container Apps (ACA) and Azure Kubernetes Service (AKS). Both support modern cloud-native workloads, but they differ significantly in complexity, control, and use cases.
Abstraction vs Control
ACA is a fully managed, serverless container platform built on Kubernetes, but it abstracts away the Kubernetes layer entirely. You don’t need to manage clusters, pods, or nodes. You define your app, environment, and scaling rules, and Azure handles the rest.
In contrast, AKS is a managed Kubernetes service that gives you full control over your cluster and workloads. You manage node pools, configure deployments, manage Helm charts, and operate like a traditional Kubernetes cluster.
Scaling and Operations
ACA uses KEDA natively to autoscale apps based on HTTP traffic, queue length, CPU/memory usage, or custom events. It can scale to zero, making it ideal for bursty or event-driven workloads.
AKS supports KEDA and HPA (Horizontal Pod Autoscaler), but you’re responsible for configuring and maintaining the scaling rules and cluster autoscaling.
Use Cases
Use Azure Container Apps if you want:
- Simplicity with containerized apps
- Event-driven microservices
- Serverless scale-to-zero capability
- Focus on code, not infrastructure
Use Azure Kubernetes Service if you need:
- Fine-grained control over Kubernetes resources
- Complex service meshes, operators, or custom CRDs
- Stateful workloads with persistent volumes
- Multi-tenant architectures or service meshes (Istio, Linkerd)
Getting Started with Azure Container Apps
Let’s walk through deploying a containerized application using ACA. We’ll start with a basic Hello World app and later expand with ACR (Azure Container Registry), scaling rules, VNet integration, and monitoring.
Prerequisites
– An active Azure subscription
– Azure CLI installed (`az — version`)
– Docker installed (`docker — version`)
– GitHub account (for optional CI/CD integration)
Walkthrough: Building, Pushing, and Deploying a Custom Image with ACR
Create a Resource Group
az group create --name my-container-apps --location westeuropeThis grouping logically organizes your Azure resources and allows you to manage them collectively. Choose a region close to your users for lower latency.
Create an Azure Container Registry (ACR)
az acr create \
  --name myAcrRegistry \
  --resource-group my-container-apps \
  --sku Basic \
  --admin-enabled true
ACR is a private container registry used for storing your Docker images. Admin-enabled allows for username/password authentication, which is necessary in this example.
Log in to ACR
az acr login --name myAcrRegistryThis authenticates your Docker CLI with the ACR instance, so you can push images to it.
Build and Push the Docker Image
docker build -t myacrregistry.azurecr.io/hello-world:v1 .
docker push myacrregistry.azurecr.io/hello-world:v1
Ensure your image name matches the ACR login server format. To confirm, use:
az acr show --name myAcrRegistry --query loginServer -o tsvCreate a Container App Environment
az containerapp env create \
  --name my-aca-env \
  --resource-group my-container-apps \
  --location westeurope
This creates a Container App Environment, which acts as a logical boundary or isolation layer for your Azure Container Apps.
A logical boundary is all about keeping resources in the same environment organized with common settings and infrastructure, like networking, security policies, logging, and metrics. For instance, the Container App Environment gives you a simple way to run and manage multiple Container Apps together, making handling their operations and configurations easier.
When you set up a Container App Environment, you group related Container Apps in a way that simplifies the management of shared resources. This helps keep things tidy by clearly separating different app groups or stages, like production vs. development.
Deploy the App Using ACR Image
The following Azure CLI command deploys an Azure Container App using a container image stored in an Azure Container Registry (ACR):
az containerapp create \
  --name hello-acr-app \
  --resource-group my-container-apps \
  --environment my-aca-env \
  --image myacrregistry.azurecr.io/hello-world:v1 \
  --target-port 80 \
  --ingress external \
  --registry-server myacrregistry.azurecr.io \
  --registry-username $(az acr credential show --name myAcrRegistry --query username -o tsv) \
  --registry-password $(az acr credential show --name myAcrRegistry --query passwords[0].value -o tsv)
Explanation of Command Flags:
— name hello-acr-app: This flag specifies the unique name for your Container App within the resource group. Choose a clear, descriptive identifier that reflects the app’s purpose.
— resource-group my-container-apps: Defines the Azure Resource Group where your Container App is created. A resource group logically groups Azure resources together, making it easier to manage, monitor, and control access permissions collectively.
— environment my-aca-env: Associates the app with a previously created Container App Environment. The environment acts as a logical container that provides shared infrastructure and configuration such as networking (VNet integration), logging, monitoring, and security policies for multiple Container Apps.
— image myacrregistry.azurecr.io/hello-world:v1: Specifies the container image source from Azure Container Registry (ACR). The provided format includes:
Registry URL (myacrregistry.azurecr.io): This is the fully-qualified URL of your private Azure Container Registry.
Image name and tag (hello-world:v1): Indicates the container image (hello-world) and the version/tag (v1). Specifying a tag ensures you’re deploying a specific, known version of your containerized application.
— target-port 80: This flag specifies the port number your container listens on internally. Azure Container Apps will forward incoming requests from the ingress to this port on your container. Ensure this matches the port your app configures to listen on within the container.
— ingress external: Enables ingress to the Container App from the internet. Setting it as external configures a publicly accessible URL endpoint, allowing external clients or users to access your application over HTTP(S).
Other possible values include:
- internal: Only accessible within the environment or VNet.
- external: Publicly accessible on the internet.
— registry-server myacrregistry.azurecr.io: Explicitly declares the registry server hosting your container images. This is the server URL for the Azure Container Registry.
— registry-username and — registry-password: These flags provide credentials required by Azure Container Apps to securely authenticate and pull container images from a private Azure Container Registry (ACR).
View App URL
az containerapp show \
  --name hello-acr-app \
  --resource-group my-container-apps \
  --query properties.configuration.ingress.fqdn \
  --o tsv
This gives you the public endpoint of your running containerized app. Visit it in your browser to test the deployment.
Managing and Monitoring Azure Container Apps
Environment and Revision Management
Azure Container Apps (ACA) environments provide a structured way to host multiple containerized applications. Each ACA environment can include multiple container apps, with optional network isolation to enhance security. Whenever you change the configuration of an app — for example, updating environment variables, scaling rules, or container images — ACA automatically creates a new revision of the app. Each revision represents a specific, deployable snapshot of your application’s configuration and container state.
To manage revisions, ACA distinguishes between ‘latest’ and ‘stable’ revisions:
Latest Revision: The most recent deployment or configuration change you’ve applied to the container app. It’s typically used for testing new features or updates in a controlled manner.
Stable Revision: A specific revision explicitly marked as stable, representing a reliable, verified state of your application. You typically route the majority of production traffic to this revision.
ACA supports advanced deployment strategies, such as canary deployments, by enabling traffic splitting between revisions. For instance, you can route traffic evenly (e.g., 50/50) between your latest revision and the stable revision to evaluate the performance and stability of recent changes before fully adopting them.
You can list all revisions of your app with:
az containerapp revision list \
 -- name hello-acr-app \
To split traffic equally between the latest and stable revisions, you can run:
az containerapp update \
 --name hello-acr-app \
 --resource-group my-container-apps \
 --traffic-weight latest=50 stable=50
This approach allows controlled exposure of new features or configurations, reducing risk and ensuring seamless user experiences.
Monitoring with Azure Monitor
As your applications scale and evolve, observability becomes crucial for maintaining reliability and performance. Azure Container Apps integrates natively with Azure Monitor, Log Analytics, and Application Insights, providing deep insights into logs, metrics, revisions, scaling events, and errors — all without custom instrumentation.
Let’s break down how to monitor and visualize ACA telemetry with Kusto Query Language (KQL) and Azure Dashboards.
Walkthrough: Creating a Dashboard for ACA Monitoring
Open Azure Dashboard
- Navigate to the Azure Portal
- In the search bar, type “Dashboard”
- Click “New Dashboard”
- Give it a name like ACA Monitoring
Pin a Log Query to the Dashboard
- Open your Log Analytics Workspace (linked to ACA diagnostics).
- Go to Logs.
- Run the following sample KQL query:
#kql
ContainerAppConsoleLogs
| where AppName == "hello-acr-app"
| where Log_s contains "GET"
| project TimeGenerated, AppName, RevisionName, Log_s
| sort by TimeGenerated desc
Click “Pin to Dashboard” (top right) → Select your dashboard.
Tip: You can filter for POST, errors, or even specific custom log statements based on Log_s.
Step 3: Add Metrics to Dashboard
You can also pin standard metrics like CPU usage, memory usage, and requests per second:
- Go to your Container App resource
- Navigate to Metrics
- Select:
- Metric namespace: ContainerApp
- Metric: CpuUsageSeconds, MemoryWorkingSetBytes, or Requests
- Set aggregation (e.g., average, max)
- Click Pin to dashboard
Repeat for different metrics to build a holistic view.
Step 4: Layout the Dashboard
- Once all tiles are pinned, go back to the dashboard
- Click “Edit”
- Resize and organize tiles logically (logs on one side, metrics on another)
- Save layout
Advanced KQL Queries for ACA Logs
Once diagnostics are enabled, logs are streamed to your Log Analytics workspace under tables like:
- ContainerAppConsoleLogs
- ContainerAppSystemLogs
- ContainerAppHttpLogs
Here are some practical examples:
Query 1: View Most Recent Logs
# kql
ContainerAppConsoleLogs
| where AppName == "hello-acr-app"
| sort by TimeGenerated desc
| limit 50
Query 2: Filter Logs for Errors or Warnings
# kql
ContainerAppConsoleLogs
| where AppName == "hello-acr-app"
| where Log_s has_any ("error", "exception", "fail")
| sort by TimeGenerated desc
Query 3: Analyze Request Traffic by Revision
# kql
ContainerAppHttpLogs
| where AppName == "hello-acr-app"
| summarize count() by RevisionName, bin(TimeGenerated, 5m)
| render timechart
This is useful for spotting traffic spikes or comparing load across revisions.
Query 4: CPU and Memory Trends
# kql
ContainerAppSystemLogs
| where AppName == "hello-acr-app"
| summarize avg(CpuUsageSeconds), avg(MemoryWorkingSetBytes) by bin(TimeGenerated, 1m)
| render timechart
A sample Azure Dashboard JSON can be imported directly into the Azure Portal. It includes key visualizations for CPU usage, memory usage, request traffic, and a Kusto query log view for ACA logs.
# Azure Dashboard JSON for ACA Monitoring
{
  "properties": {
    "lenses": {
      "0": {
        "order": 0,
        "parts": {
          "0": {
            "position": {
              "x": 0,
              "y": 0,
              "rowSpan": 6,
              "colSpan": 6
            },
            "metadata": {
              "inputs": [
                {
                  "name": "resourceType",
                  "value": "microsoft.app/containerapps"
                },
                {
                  "name": "resourceName",
                  "value": "<REPLACE-WITH-YOUR-APP-NAME>"
                },
                {
                  "name": "metricNamespace",
                  "value": "microsoft.app/containerapps"
                },
                {
                  "name": "chartTitle",
                  "value": "CPU Usage (sec)"
                },
                {
                  "name": "metrics",
                  "value": [
                    {
                      "metricName": "CpuUsageSeconds",
                      "aggregation": "Average"
                    }
                  ]
                }
              ],
              "type": "Extension/MetricsChartPart"
            }
          },
          "1": {
            "position": {
              "x": 6,
              "y": 0,
              "rowSpan": 6,
              "colSpan": 6
            },
            "metadata": {
              "inputs": [
                {
                  "name": "resourceType",
                  "value": "microsoft.app/containerapps"
                },
                {
                  "name": "resourceName",
                  "value": "<REPLACE-WITH-YOUR-APP-NAME>"
                },
                {
                  "name": "metricNamespace",
                  "value": "microsoft.app/containerapps"
                },
                {
                  "name": "chartTitle",
                  "value": "Memory Usage (bytes)"
                },
                {
                  "name": "metrics",
                  "value": [
                    {
                      "metricName": "MemoryWorkingSetBytes",
                      "aggregation": "Average"
                    }
                  ]
                }
              ],
              "type": "Extension/MetricsChartPart"
            }
          },
          "2": {
            "position": {
              "x": 0,
              "y": 6,
              "rowSpan": 8,
              "colSpan": 12
            },
            "metadata": {
              "inputs": [
                {
                  "name": "query",
                  "value": "ContainerAppHttpLogs\n| where AppName == \"hello-acr-app\"\n| summarize count() by bin(TimeGenerated, 5m)\n| render timechart"
                },
                {
                  "name": "version",
                  "value": "KqlItem/1.0"
                },
                {
                  "name": "queryType",
                  "value": "Kusto"
                },
                {
                  "name": "resourceType",
                  "value": "microsoft.operationalinsights/workspaces"
                },
                {
                  "name": "resourceId",
                  "value": "<REPLACE-WITH-YOUR-LOG-WORKSPACE-RESOURCE-ID>"
                },
                {
                  "name": "partTitle",
                  "value": "HTTP Request Count"
                }
              ],
              "type": "Extension/KqlPart"
            }
          },
          "3": {
            "position": {
              "x": 0,
              "y": 14,
              "rowSpan": 10,
              "colSpan": 12
            },
            "metadata": {
              "inputs": [
                {
                  "name": "query",
                  "value": "ContainerAppConsoleLogs\n| where AppName == \"hello-acr-app\"\n| sort by TimeGenerated desc\n| project TimeGenerated, Log_s\n| take 50"
                },
                {
                  "name": "version",
                  "value": "KqlItem/1.0"
                },
                {
                  "name": "queryType",
                  "value": "Kusto"
                },
                {
                  "name": "resourceType",
                  "value": "microsoft.operationalinsights/workspaces"
                },
                {
                  "name": "resourceId",
                  "value": "<REPLACE-WITH-YOUR-LOG-WORKSPACE-RESOURCE-ID>"
                },
                {
                  "name": "partTitle",
                  "value": "Latest Console Logs"
                }
              ],
              "type": "Extension/KqlPart"
            }
          }
        }
      }
    },
    "metadata": {
      "model": {
        "timeRange": {
          "value": {
            "relative": {
              "duration": 3600000
            }
          },
          "type": "MsPortalFx.Composition.Configuration.ValueTypes.TimeRange"
        }
      }
    }
  },
  "name": "aca-monitoring-dashboard",
  "type": "Microsoft.Portal/dashboards",
  "location": "westeurope",
  "tags": {}
}
Instructions for Importing
- Go to Dashboard in the Azure Portal
- Click “New Dashboard” → “Upload JSON”.
- Paste the above JSON into a text file and upload it.
- Replace:
- <REPLACE-WITH-YOUR-APP-NAME> — your ACA app name (e.g., hello-acr-app)
- <REPLACE-WITH-YOUR-LOG-WORKSPACE-RESOURCE-ID> — your Log Analytics Workspace resource ID (you can get this from az monitor log-analytics workspace show …)
This is an enhanced version of the Azure Dashboard JSON with an alert example included. The alert will monitor CPU usage and trigger when the average CPU exceeds 80% over a 5-minute window.
This includes:
- CPU & Memory charts
- HTTP request timechart
- Recent console logs
- A tile linking to active alerts for easy visibility
# Azure Dashboard JSON with Alert Monitoring
{
  "properties": {
    "lenses": {
      "0": {
        "order": 0,
        "parts": {
          "0": {
            "position": { "x": 0, "y": 0, "rowSpan": 6, "colSpan": 6 },
            "metadata": {
              "inputs": [
                {
                  "name": "resourceType",
                  "value": "microsoft.app/containerapps"
                },
                {
                  "name": "resourceName",
                  "value": "<REPLACE-WITH-YOUR-APP-NAME>"
                },
                {
                  "name": "metricNamespace",
                  "value": "microsoft.app/containerapps"
                },
                {
                  "name": "chartTitle",
                  "value": "CPU Usage (sec)"
                },
                {
                  "name": "metrics",
                  "value": [
                    {
                      "metricName": "CpuUsageSeconds",
                      "aggregation": "Average"
                    }
                  ]
                }
              ],
              "type": "Extension/MetricsChartPart"
            }
          },
          "1": {
            "position": { "x": 6, "y": 0, "rowSpan": 6, "colSpan": 6 },
            "metadata": {
              "inputs": [
                {
                  "name": "resourceType",
                  "value": "microsoft.app/containerapps"
                },
                {
                  "name": "resourceName",
                  "value": "<REPLACE-WITH-YOUR-APP-NAME>"
                },
                {
                  "name": "metricNamespace",
                  "value": "microsoft.app/containerapps"
                },
                {
                  "name": "chartTitle",
                  "value": "Memory Usage (bytes)"
                },
                {
                  "name": "metrics",
                  "value": [
                    {
                      "metricName": "MemoryWorkingSetBytes",
                      "aggregation": "Average"
                    }
                  ]
                }
              ],
              "type": "Extension/MetricsChartPart"
            }
          },
          "2": {
            "position": { "x": 0, "y": 6, "rowSpan": 8, "colSpan": 12 },
            "metadata": {
              "inputs": [
                {
                  "name": "query",
                  "value": "ContainerAppHttpLogs\n| where AppName == \"hello-acr-app\"\n| summarize count() by bin(TimeGenerated, 5m)\n| render timechart"
                },
                {
                  "name": "version",
                  "value": "KqlItem/1.0"
                },
                {
                  "name": "queryType",
                  "value": "Kusto"
                },
                {
                  "name": "resourceType",
                  "value": "microsoft.operationalinsights/workspaces"
                },
                {
                  "name": "resourceId",
                  "value": "<REPLACE-WITH-YOUR-LOG-WORKSPACE-RESOURCE-ID>"
                },
                {
                  "name": "partTitle",
                  "value": "HTTP Request Count"
                }
              ],
              "type": "Extension/KqlPart"
            }
          },
          "3": {
            "position": { "x": 0, "y": 14, "rowSpan": 10, "colSpan": 12 },
            "metadata": {
              "inputs": [
                {
                  "name": "query",
                  "value": "ContainerAppConsoleLogs\n| where AppName == \"hello-acr-app\"\n| sort by TimeGenerated desc\n| project TimeGenerated, Log_s\n| take 50"
                },
                {
                  "name": "version",
                  "value": "KqlItem/1.0"
                },
                {
                  "name": "queryType",
                  "value": "Kusto"
                },
                {
                  "name": "resourceType",
                  "value": "microsoft.operationalinsights/workspaces"
                },
                {
                  "name": "resourceId",
                  "value": "<REPLACE-WITH-YOUR-LOG-WORKSPACE-RESOURCE-ID>"
                },
                {
                  "name": "partTitle",
                  "value": "Latest Console Logs"
                }
              ],
              "type": "Extension/KqlPart"
            }
          },
          "4": {
            "position": { "x": 0, "y": 24, "rowSpan": 6, "colSpan": 12 },
            "metadata": {
              "type": "Extension/AzureResourceHealthPart",
              "inputs": [
                {
                  "name": "resourceType",
                  "value": "microsoft.insights/metricalerts"
                },
                {
                  "name": "resourceIds",
                  "value": [
                    "<REPLACE-WITH-YOUR-ALERT-RULE-RESOURCE-ID>"
                  ]
                },
                {
                  "name": "partTitle",
                  "value": "Active Alerts (CPU > 80%)"
                }
              ]
            }
          }
        }
      }
    },
    "metadata": {
      "model": {
        "timeRange": {
          "value": {
            "relative": {
              "duration": 3600000
            }
          },
          "type": "MsPortalFx.Composition.Configuration.ValueTypes.TimeRange"
        }
      }
    }
  },
  "name": "aca-monitoring-dashboard-alerts",
  "type": "Microsoft.Portal/dashboards",
  "location": "westeurope",
  "tags": {}
}
Replace the following placeholders in the script:
- <REPLACE-WITH-YOUR-APP-NAME> -> Your ACA app name (e.g., hello-acr-app)
- <REPLACE-WITH-YOUR-LOG-WORKSPACE-RESOURCE-ID> -> Resource ID of your Log Analytics Workspace
- <REPLACE-WITH-YOUR-ALERT-RULE-RESOURCE-ID> -> Resource ID of your Azure Monitor Metric Alert for CPU threshold
Dapr and Distributed Tracing in Azure Container Apps
When building microservices, it’s common to encounter service discovery, state management, pub/sub, and distributed tracing. This is where Dapr (Distributed Application Runtime) excels, and Azure Container Apps makes it easy to enable with just a few flags.
What is Dapr?
Dapr is an open-source, portable runtime that helps developers build resilient, stateless, and stateful microservices. It abstracts away the boilerplate code needed for service-to-service communication, pub/sub messaging, and external state store integrations.
In ACA, enabling Dapr launches a sidecar container next to your app. This sidecar handles:
- Service-to-service calls over HTTP/gRPC
- Pub/Sub messaging with built-in brokers
- State management (Redis, Cosmos DB, etc.)
- Input/output bindings
- Secrets and configuration
- Distributed tracing
Enabling Dapr in Azure Container Apps
Let’s walk through enabling Dapr for your app and viewing tracing information.
Enable Dapr on your container app
az containerapp update \
  --name hello-acr-app \
  --resource-group my-container-apps \
  --enable-dapr \
  --dapr-app-id hellodapr \
  --dapr-app-port 80
Explanation of flags:
- — enable-dapr: Activates the Dapr sidecar
- — dapr-app-id: A unique logical name used for service discovery (other services can call this app via http://hellodapr)
- — dapr-app-port: The internal port your container listens on (used by Dapr for ingress)
Once enabled, your app and the Dapr sidecar run together inside the ACA environment.
Making Service-to-Service Calls with Dapr
If you had another ACA with Dapr enabled (frontend for example), it could call the hello-acr-app like this:
POST http://hellodapr/v1.0/invoke/hellodapr/method/hello
This allows for automatic service discovery, retries, and circuit breaking — no service mesh or Kubernetes config is needed.
Distributed Tracing with Dapr + OpenTelemetry
Dapr supports OpenTelemetry out of the box, meaning you can trace requests across services and visualize them in tools like:
Step 2: View Traces in Azure Monitor
If you enable diagnostics (as described earlier), Dapr will emit trace spans into your Log Analytics workspace.
Sample KQL query to view traces:
# kql
traces
| where customDimensions["dapr.component"] has "http"
| project timestamp, name, customDimensions, operation_Name
| sort by timestamp desc
You can use this to:
- See inbound/outbound calls
- Identify slow dependencies
- Correlate requests across microservices
Optional: Link to Application Insights
If you want advanced visualizations, live metrics, and performance monitoring:
- Create an Application Insights instance
- Link it via environment variables or diagnostic settings:
- Set APPINSIGHTS_INSTRUMENTATIONKEY
- Or enable via az monitor diagnostic-settings
Tips for Operational Monitoring
- Use Log Alerts in Azure Monitor to trigger actions (email, Teams, ITSM).
- Group metrics and logs in Workbooks for better team visibility.
- Export to Power BI for cross-environment reporting.
- Use Application Insights for advanced tracing if needed (e.g., via Dapr/OpenTelemetry).
Visualize with Workbooks
Use Azure Workbooks to build custom dashboards combining:
- Logs from Dapr sidecar
- Metrics from ACA (CPU, memory, scaling)
- Tracing spans from OpenTelemetry
This gives a unified view of microservice health and dependencies.
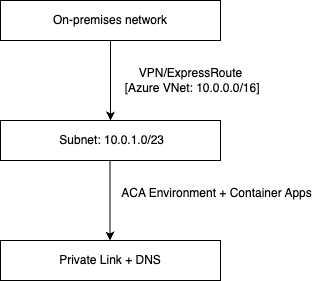
VNet Integration and Private Link for Secure Access
Integrating Azure Container Apps with a Virtual Network (VNet) allows you to securely connect your apps to private Azure services, databases, and on-premises networks. Adding Private Link to the setup ensures your environment is accessible via private IP addresses, enhancing security by avoiding exposure to the public internet.
Step-by-Step: VNet and Private Link Setup
Create a Virtual Network and Subnet
First, create a virtual network with a dedicated subnet for ACA. The subnet must have at least a /23 CIDR to ensure enough IPs are available.
az network vnet create \
 --resource-group my-container-apps \
 --name my-vnet \
 --address-prefix 10.0.0.0/16 \
 --subnet-name my-aca-subnet \
 --subnet-prefix 10.0.1.0/23
Deploy the ACA Environment into the VNet Subnet
Now associate the ACA environment with the subnet you just created. This allows your container apps to securely communicate with other resources inside the VNet.
az containerapp env create \
 --name my-aca-env \
 --resource-group my-container-apps \
 --location westeurope \
 --infrastructure-subnet-resource-id \
 "/subscriptions/<subscription-id>/resourceGroups/my-container-apps/providers/Microsoft.Network/virtualNetworks/my-vnet/subnets/my-aca-subnet"
Make sure to replace `<subscription-id>` with your actual subscription ID.
Access PaaS Resources from ACA via VNet
Your container apps can now reach resources like Azure SQL, Cosmos DB, or Redis that are VNet-integrated or configured with Private Endpoints. Use environment variables to inject connection strings.
Enable Private Link (Optional)
Set up a private endpoint to ensure your ACA environment is reachable only via private IPs. This involves creating a private DNS zone and associating it with the VNet.
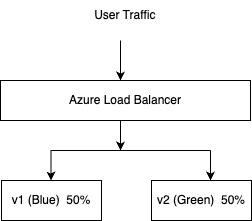
Blue/Green Deployment Strategy in ACA
Blue/Green deployments reduce downtime and risk by maintaining two environments: one for current production (blue) and one for the new version (green). ACA natively supports this model through revision-based traffic routing.
Blue/Green with Revisions
Deploy the Initial (Blue) Version
az containerapp create \
  --name myapp \
  --resource-group my-container-apps \
  --environment my-aca-env \
  --image myacr.azurecr.io/myapp:v1 \
  --ingress external \
  --target-port 80 \
  --revisions-mode multiple \
  --revision-suffix v1
This sets up the app with the revision suffix `v1` as the “blue” environment.
Deploy the New (Green) Version
az containerapp update \
  --name myapp \
  --resource-group my-container-apps \
  --image myacr.azurecr.io/myapp:v2 \
  --revision-suffix v2This creates a new revision, `v2,` without affecting traffic yet.
Split Traffic Between Blue and Green
az containerapp ingress traffic set \
 --name myapp \
 --resource-group my-container-apps \
 --revision-weight v1=50 v2=50
This allows to test the green version in production with 50% traffic while monitoring for errors.
Finalize Green Deployment
Once the green version proves stable, route 100% of traffic to it:
az containerapp ingress traffic set \
 --name myapp \
 --resource-group my-container-apps \
 --revision-weight v1=0 v2=100
Then, optionally deactivate the older revision to save costs:
az containerapp revision deactivate \
 --name myapp \
 --resource-group my-container-apps \
 --revision v1
Best Practices
– Use Application Insights to monitor response times and exceptions during the split.
– Rollback by shifting traffic back to the stable revision.
– Automate the steps using GitHub Actions or Azure DevOps Pipelines.
More Resources
– Networking in Azure Container App
– Private Endpoint Guide
– Traffic Splitting in Azure Container Apps
Final Thoughts
Azure Container Apps is a powerful addition to Microsoft’s cloud-native portfolio. It elegantly abstracts away the operational burden of Kubernetes while giving developers a robust environment to run containers at scale. With features like revision management, Dapr integration, event-driven scaling, and seamless CI/CD pipeline support, ACA is designed to help teams move fast — without compromising on observability, flexibility, or security.
While it’s not meant to replace Azure Kubernetes Service (AKS), ACA shines in scenarios where simplicity, rapid iteration, and cost-effectiveness are priorities. Think of APIs, microservices, background jobs, or burst workloads that benefit from scale-to-zero capabilities.
As the platform continues to evolve, we see more enterprise-grade features like VNet integration, Private Link support, and Application Insights tracing, making ACA an increasingly compelling option for startups and enterprises.
If you’re building cloud-native apps and want to offload infrastructure management while still leveraging containerization best practices, ACA is well worth exploring. Don’t forget to check the roadmap, test performance, and cost models for your specific use case, and integrate early with monitoring tools to maintain production readiness.
Do you have thoughts or questions or want to share how you use ACA in real-world projects? I’d love to hear from you — drop a comment below or connect with me on LinkedIn. Let’s build better, faster, and smarter in the cloud.
Want to know more about what we do?
We are your dedicated partner. Reach out to us.