

The Amplify Series, Part 7: Track app usage with Amplify Analytics
In the previous part of this series, we added the Amplify Predictions category, which allowed us to use the power of AI and Machine learning to identify text in images, convert text to speech and interpret sentiment of the text. In this part of the blog series, we will add functionality to be able to track the usage of our application in order to learn how our users use the application and be able to improve the application user experience based on this information. We will do this by adding the Amplify category called Amplify Analytics.
We will start by adding this category to the project. We will create a new page for the Amplify Analytics category and add some interactable elements to that page so that we can track the usage of these elements. We will also be updating the previous pages when needed in order to track the usage of those pages. In the end, you will have a better understanding of this category and be able to track the usage of your Amplify application.
We will continue in the repository where we left off in the previous blog post.
Adding the Analytics category
We will start by generating the backend resources needed for the tracking functionality.
We will run amplify add analytics with the following options:
- Analytics provider: Amazon Pinpoint
- Resource name: <<use default>>
- Unauthenticated users: No
? Select an Analytics provider Amazon Pinpoint
✔ Provide your pinpoint resource name: · theamplifyapp
⚠️ Auth configuration is required to allow unauthenticated users, but it is not configured properly.
⚠️ Adding analytics would add the Auth category to the project if not already added.
? Apps need authorization to send analytics events. Do you want to allow guests and unauthenticated users to send analytics events? (we recommend you a
llow this when getting started) No
⚠️ Authorize only authenticated users to send analytics events. Use "amplify update auth" to modify this behavior.
✅ Successfully updated auth resource locally.
✅ Successfully added resource theamplifyapp locally
This command will add a new directory called analytics to our amplify/backend directory, which will contain information needed to create the resources in AWS to support the new functionality.
We will run amplify push to create these resources in AWS. The AWS service used here are Amazon Pinpoint.
Note that using this service will cost you money. The first 100 million events recorded per month are free. After that, you pay $0.000001 per event you collect. A piece of general advice: configure a budget with billing alerts for your AWS account so you don’t get surprised by high costs.
After running the amplify push command you will not be charged since the application must be configured to send events to AWS Pinpoint. Once we configure this, however, the application will automatically start sending a minimal set of events such as page visits. This can be turned off and will be covered in the next section.
Once we have created the resources, we can run amplify console analytics to open the Amazon Pinpoint console. Initially, all charts should be empty:

In the next step, we will configure the frontend application to start sending data to Amazon Pinpoint to fill these graphs.
Configuring the frontend for Analytics
To start, we will update our main.ts to include the following:
import { Predictions, Analytics } from 'aws-amplify';By simply importing this dependency,running the application again and visiting it in the browser, we can see that the charts are being updated:

We can also click on the demographics to see information about the users:

With this small addition to the frontend application, we can now see how much the application is being used and from what type of devices. If you want to have more information about the users of the application, it is possible to customize the information sent about a user. We will not cover that part in this blog, however, a complete example can be found on this page.
Session tracking
The session metric in AWS Pinpoint provides information about how often your application has been opened. However, once a session is registered for a device (mobile, browser, etc.) the session counter does not go up if the same device visits the site again within a certain time period. Refreshing the page or closing the browser and opening it again is not a new session. This is because the Amplify SDK creates a unique identifier for your device.
After the page has not been active on the device for some time or if your application manually calls Analytics.stopSession the session will terminate. Opening the page again after this will register as a new session.
The session is tracked by default, however, you can turn it off by adding the following code in the main.ts:
Analytics.autoTrack('session', {
    enable: false
});
Page view tracking
We can also configure the application to track which pages are visited. We will update the main.ts with the following:
Analytics.autoTrack('pageView', {
  enable: true,
  type: 'SPA',
  attributes: {
    url: window.location.origin + window.location.pathname
  },
})
Now you can run your application and visit some of the pages. If you visit the events page in AWS Pinpoint you can see how much each page is viewed:
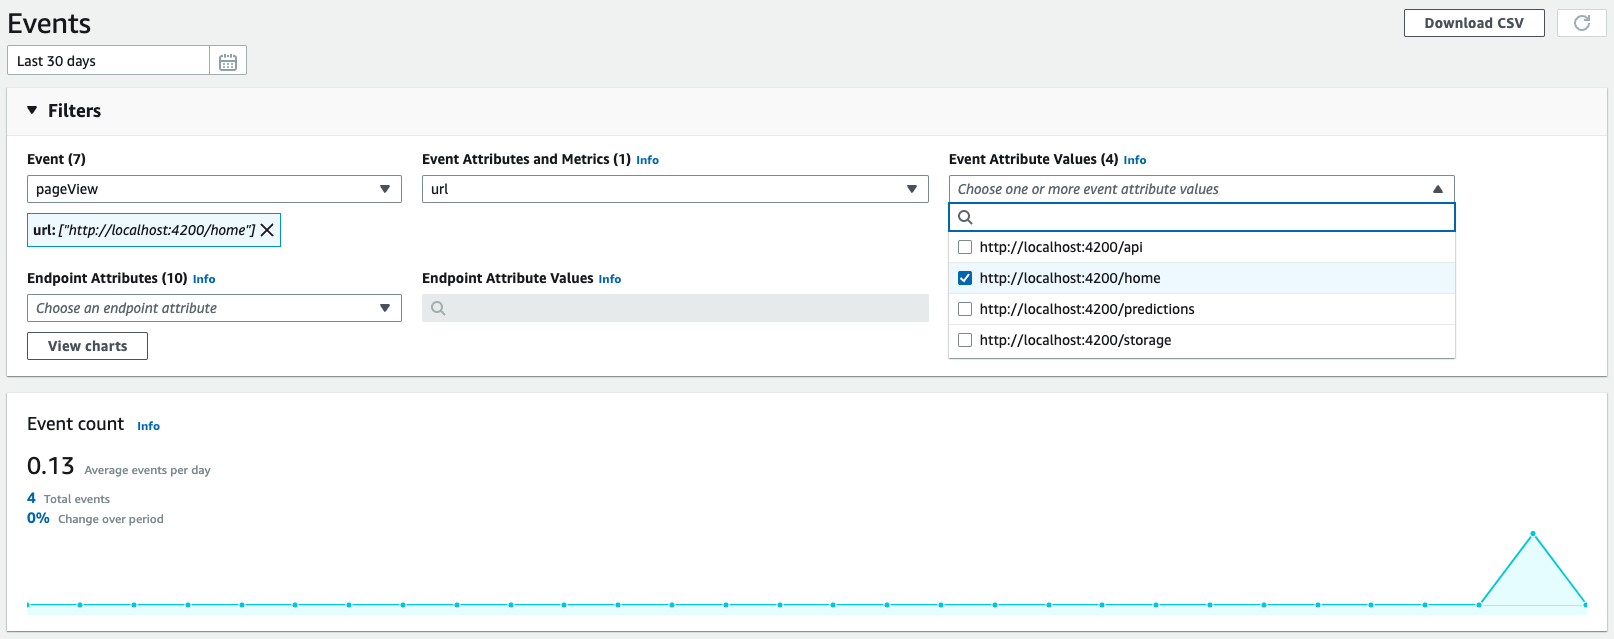
Disclaimer: It can take up to 30 minutes for the events to show up in Pinpoint.
Recording events
We can record events such as clicks on the pages with Amplify Analytics. This section describes two ways to do that.
Manual event recording
The first way is to do it manually. We will update our text-to-speech.component.ts to send an event to AWS Pinpoint every time the user uses the text-to-speech functionality. The event will contain the text that the user entered:
// Other imports
import { Predictions, Analytics } from 'aws-amplify';  // <--- Add import

@Component({
  selector: 'app-text-to-speech',
  templateUrl: './text-to-speech.component.html',
  styleUrls: ['./text-to-speech.component.css']
})
export class TextToSpeechComponent implements OnInit {
  // Other existing code

  convertToAudio = async () => {
    if (!this.textInput) {
      return;
    }

    // Add this
    Analytics.record({
      name: 'convertedTextToSpeech',
      attributes: { textInput: this.textInput },
      immediate: true
    });

    // Other existing code
  };

  // Other existing code
}
This will now show up in our events every time a user uses this functionality:
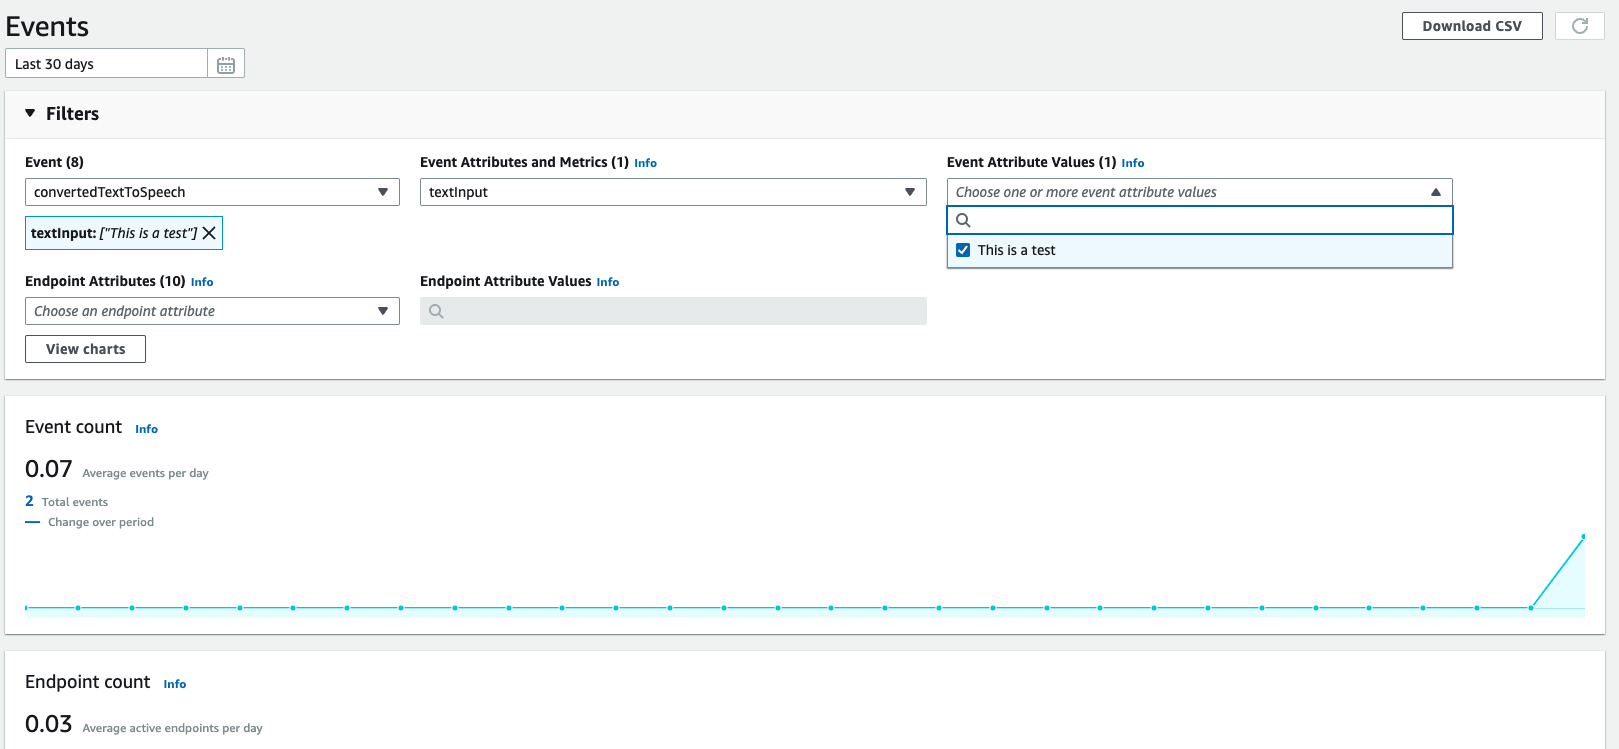
In a real application you might not want to set an attribute value as we did here for an input field. Since the users of the application are free to enter any value they want, the attribute value list in the filters will explode. However, this example gives an impression of what is possible with the minimal setup we have so far.
Automatic event recording
The other way to record events is to set up an event tracker that will activate when an element contains certain properties. We will update the main.ts to include the following:
Analytics.autoTrack('event', {
  enable: true,
  events: ['click'],
  selectorPrefix: 'data-amplify-analytics-'
});
This will track all click events for HTML elements that have properties with the prefix data-amplify-analytics-.
We will now update our comments.component.html to make use of this so that an event is sent to AWS Pinpoint every time someone adds a comment to the post.
<!-- Other existing code -->
<div class="col-lg-4">
<button
class="aws-button"
data-amplify-analytics-on="click"
data-amplify-analytics-name="commentAdded"
(click)="addComment()"
>
Add Comment
</button>
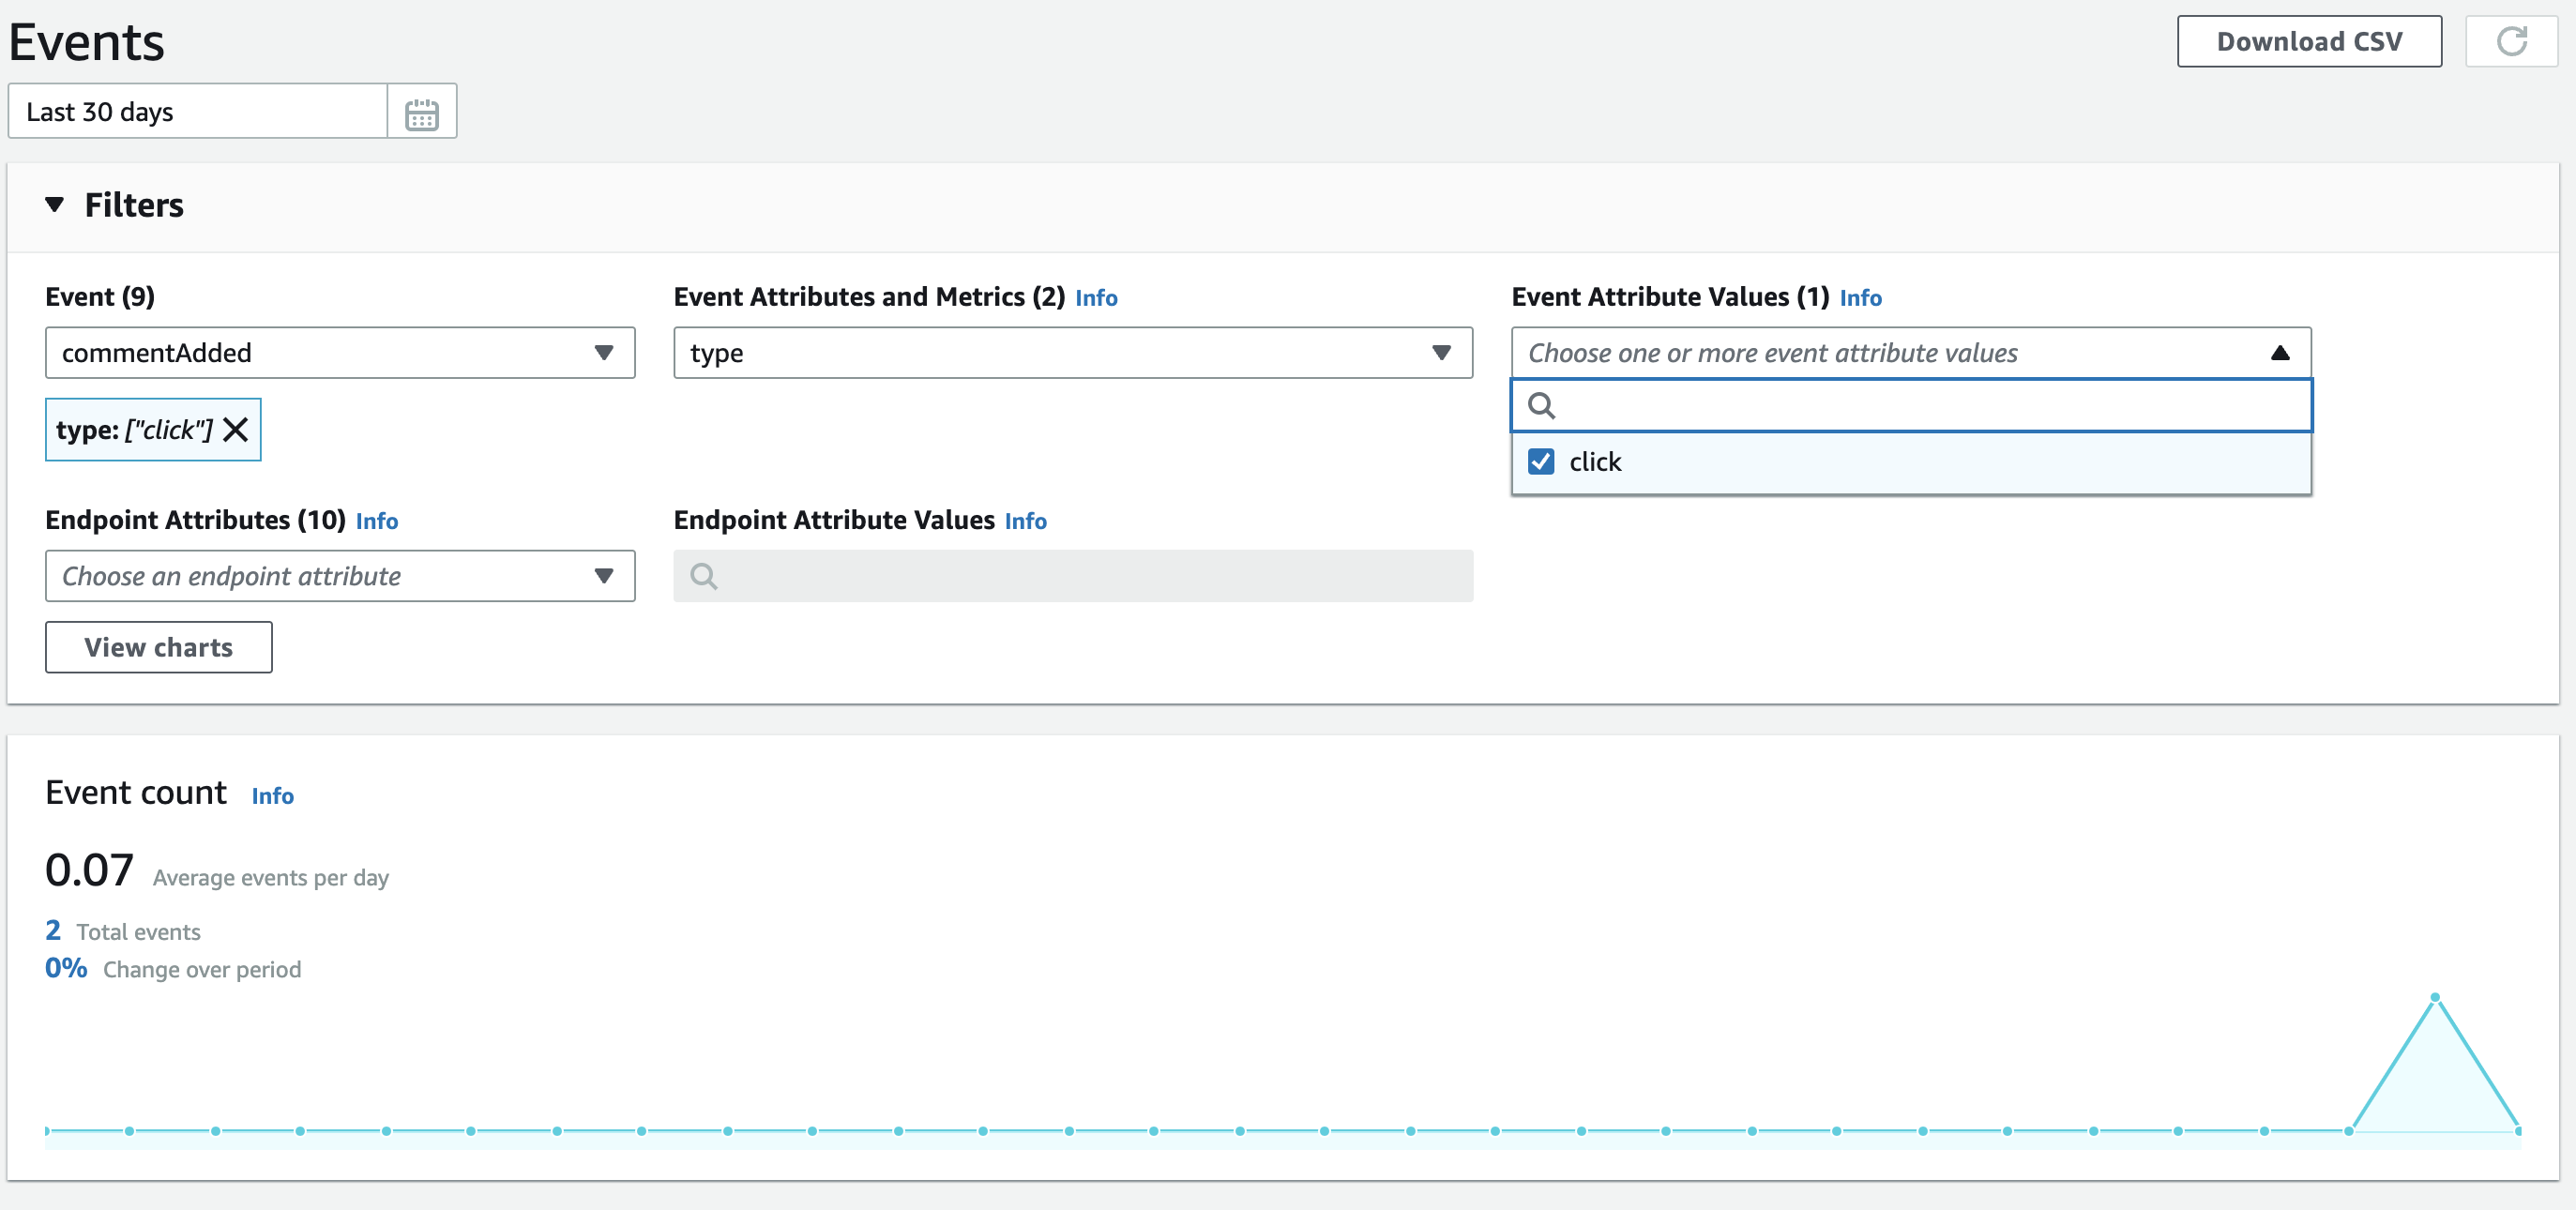
</div>
<!-- Other existing code -->This event will also show up similar to the previous one in our events dashboard:
We now have enough tools to be able to track the usage in our application.
The following code changes have been made to our repository in this article:
Amplify Analytics vs Google Analytics
When deciding to track app usage, you can also use Google Analytics, which is unarguably more feature-rich and streamlined than Amplify Analytics.
Amplify Analytics uses AWS Pinpoint, which has analytics capabilities but is more focused on user interaction, such as sending emails and notifications for campaigns.
Google Analytics is the industry standard when it comes to Analytics as it provides many features and is very user-friendly compared to AWS Pinpoint in my opinion. So how do you choose between the two?
My advice would be to choose AWS Pinpoint if you want to get a quick view of the usage of your application. If you already have an Amplify application, you can get up and running with analytics with just a few changes to your application as we have seen in this blog post.
If you want to go further than seeing the general usage, event usage, and demographics, then you should consider using Google Analytics, especially if you or someone on your team already has experience with it.
Up next: Location functionality with Amplify Geo
In this blog we have used Amplify Analytics to track the app usage of our application. As with the previous categories, there is more that you can do with this category than what is covered in this article, so be sure to check the documentation for more information. In the next article, we will take a look at how to use Amplify Geo to add location-based functionality.
Want to know more about what we do?
We are your dedicated partner. Reach out to us.