Infrastructure metrics with Elasticsearch stack
For the operations team of any IT organisation it’s of utmost importance to have an overview of it’s infrastructure at any given point of time, whether it’s the response time of various customer facing systems or memory consumption stats of the processes running across servers.
Traditionally, these stats were explored after some problem has occurred which can be anything from slow response time to certain processes taking over the CPU cycles. Thus it’s better to have a real-time insight into the infrastructure stats which enables DevOps team to quickly find and fix the cause rather than waiting for the problem to occur. In this blog post we would be exploring the Elasticsearch product stack to propose a solution for effective monitoring of the infrastructure using Elasticsearch, Kibana and Beats. Beats shippers are part of the Elasticsearch product stack, mainly classified into PacketBeat and TopBeat. These shippers integrate seamlessly with Elasticsearch and Kibana and thus are very useful for generating infrastructure metrics. PacketBeat is used for monitoring real-time network traffic for application level protocols like HTTP, MySQL etc as well as support for DNS which is based on UDP protocol. Whereas TopBeat is the new addition to the Elastic family and it’s basically the visual counter-part of the Top command used in the terminal. Using TopBeat we can get system wide stats of memory usage (free/available) and also process specific stats, i.e. Top 10 memory consuming processes, disk space used by the process etc. PacketBeat It analyzes network packets in real-time and correlates requests with responses in order to log them as specific transactions. For each transaction it records the protocol specific fields in the ElasticSearch indices. Some examples – Mysql fields Mysql. affected_rows – Number of rows affected by the operation Mysql. num_fields – Incase of successful “Select” how many fields are returned. Mysql.num_rows – Incase of successful “Select” how many rows are returned. Query – complete query which was executed. Along with other fields like server and client IP, timestamp and if the query failed then related error information. Http Fields Http.code – Http code Http.content_length – size of the entity-body Along with other fields like path, params, query, response time, status etc Apart from the protocol specific fields there are some fields which are generic for all transactions for a complete list of fields please see here Protocols supported by PacketBeat are –
- HTTP
- PostgreSQL
- MySQL
- Thrift-RPC
- Redis
- Mongodb
- Memcache
- DNS
Packetbeat can either be installed on the existing application servers or dedicated servers. Installing them on dedicated servers reduces the load on the application servers but it’s also more costly specially in an cloud hosted environment. By using port mirroring or tap devices the network packets can be analyzed in case the packbeat is installed on the dedicated server and if it’s on the same server as the application then by analyzing packets on network interfaces specified in the configuration file. The network stats would either be sent directly by PacketBeat to ElasticSearch for creating index or if an logstash indexing instance is being used for aggregating logs from various sources and then sending them finally to ElasticSearch thus in that case we would write the json output of Packetbeat first to Redis as currently the direct integration between logstash and Packetbeat doesn’t exist.
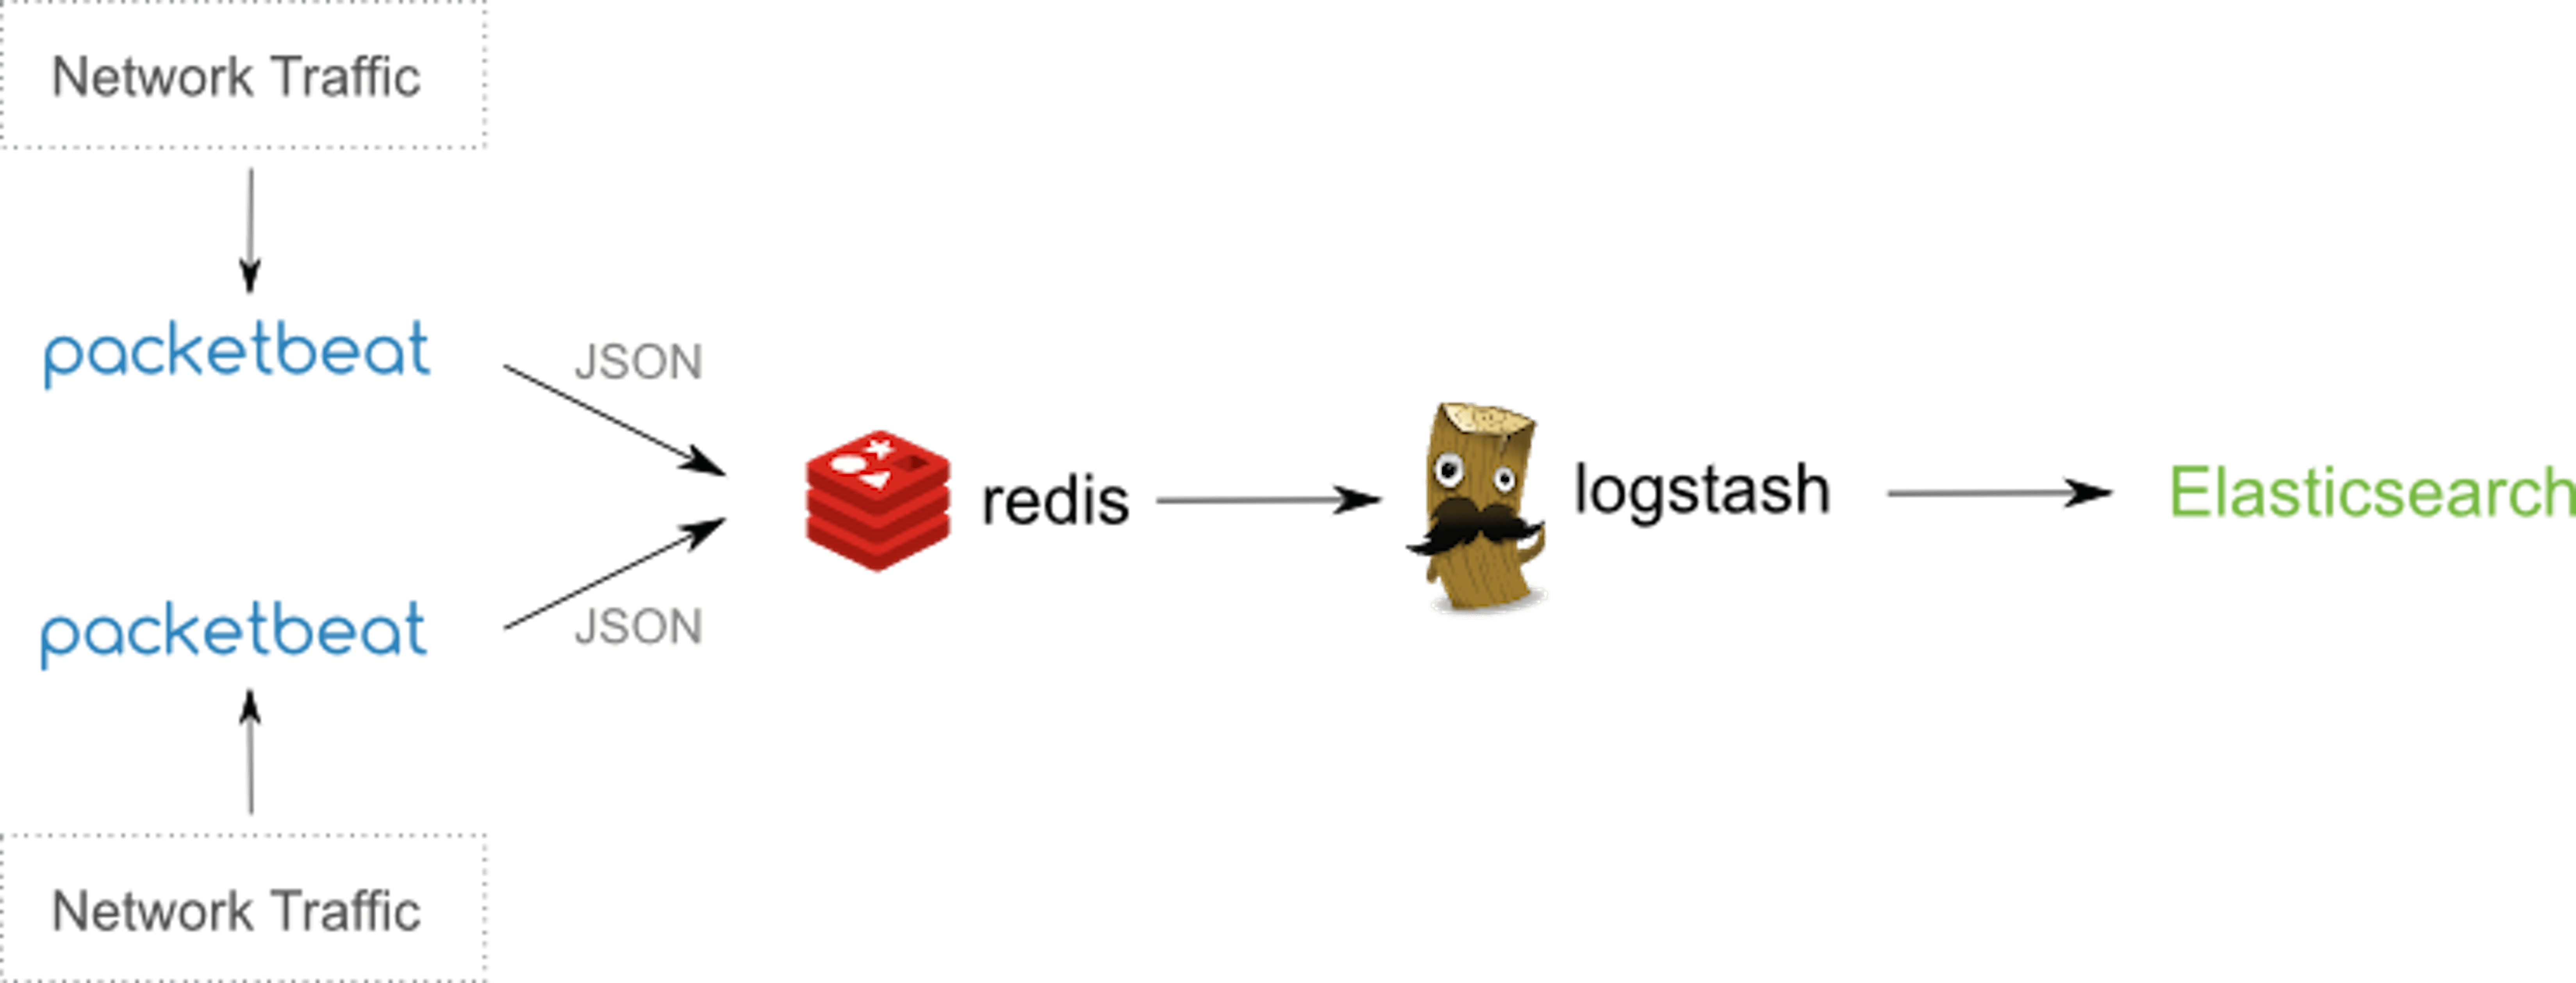
Figure 1- Taken from official documentation of Packetbeat Packetbeat installation is straightforward for linux and mac, for windows you need to have the powershell installed on your machine. Since I have a mac thus the commands and configuration would be mac specific and it’s not much different from linux configuration. Before installing Packetbeat please make sure you have ElasticSearch and Kibana installed on your machine. PacketBeat ships the json data to ElasticSearch for indexing and that index data is displayed in graphs in Kibana. Once you have downloaded and unzipped the Packetbeat, following are the important sections prefilled in packetbeat.yml configuration file.
interfaces:
  device: any
In the device section, it’s the network interfaces that need to be monitored are mentioned, using the keyword “any” implies that all network interfaces need to be sniffed for packets, current “any” is supported on Linux and not on mac. On Mac for every individual network interface there needs to be separate Packetbeat instance running , for example If I want to monitor the internet traffic as well as the MySQL running on localhost then I would need to start 2 instances of PacketBeat one having the device as “en0” (HTTP/DNS monitoring) and other as “lo0” (MySQL monitoring). For each protocol to be monitored you need to mention the network port, Example –
memcache:
  ports: [11211]
mysql:
  ports: [3306]
The configuration file already contains the default ports of the protocols supported, additional ports can be added by using comma separated values. Like in HTTP –
http:
  ports: [80, 8080, 8000, 8002]
  send_headers: ["Host"]
Also note, you can add the http header to the JSON o/p of the packetBeat by specifying the “send_headers” options which can contains HTTP headers. In my case I wanted the domain name of the website visited which is contained in the “Host” header of the request. You can further add more headers like “User-Agent”, “Cookie” etc. In the http configuration, you can specify the scenario in which you would like to hide certain parameters like “password” from being written to JSON o/p, thus the http configuration becomes –
http:
   ports: [80, 8080, 8000, 5000, 8002]
   send_headers: ["Host"]
   hide_keywords: ["pass", "password", "passwd"]
Apart from the application protocols, you can also customize the shipper that Packetbeat uses, following are the major options available –
shipper:
  name: “MyShipper”
  tags: [“webserver”]
  ignore_outgoing: true
Name attribute specifies the name of the shipper, the tags attribute helps in grouping together of various shippers, for example if you have a cluster of webservers then all the different shippers should have a common binding tag data which make it easy to create grouped visualisation in Kibana based on common tag values. The “ignore_outgoing” attribute is basically is avoid the scenario of a single transaction across multiple servers to be logged twice, i.e. only incoming transaction are logged and outgoing transactions are ignored thus removing the chance of logging duplicate transactions. PacketBeat output PacketBeat can write to either Elasticsearch, Redis or File. Example configuration –
output:
# Elasticsearch as output
elasticsearch:
   enabled: true
   hosts: ["localhost:9200"]
   save_topology: true
The value of enabled attribute identifies the output type out of the 3 supported. “save_topology” being set to true means that the Packetbeat shippers publish their IPs to an ElasticSearch index and all the shippers can share this information via the output plugin. You can also provide Elasticsearch authentication credentials in the yml configuration if Elasticsearch is using Shield plugin, thus Packetbeat shippers would need to be authenticated before being able to write to ES cluster. Now we are done with the configuration of Packetbeat and before you could start Packetbeat you need to make sure that the Elasticsearch cluster that you would be writing to has the template stored i.e. in Elasticsearch you can store templates such that when new indexes are created then the mapping of the fields of these new indexes conform to the template rules. The template is provided inside the file packetbeat.template.json in the installation directory to store the template on ES cluster we just need to execute the curl command (make sure ES is up and running!) –
curl -XPUT ‘http://localhost:9200/_template/packetbeat’ -d@packetbeat.template.json
Now we have the template store on ES cluster and new indexes would have the naming format as – packetbeat-YYYY.MM.DD Starting Packetbeat sudo ./packetbeat -e -c packetbeat.yml -d “publish” (on mac) sudo /etc/init.d/packetbeat start (on linux) Now, I browsed internet while Packetbeat was running and since it was listening to http requestthus it logged those requests in the ES cluster with index name packetbeat-2015.10.01 I go to my marvel (ES plugin) console and execute –
GET packetbeat-2015.10.01/_search?size=1000
And get back a total of 585 hits after few minutes of browsing which ofcourse includes all the js and css file’s GET requests as well 🙂 Here’s the complete output of a single such document –
{
"_index":"packetbeat-2015.10.01",
"_type":"http",
"_id":"AVAkFdJyMolTkkADd_vF",
"_score":1,
"_source":{
"bytes_in":1733,
"bytes_out":439,
"client_ip":"10.108.xx.xx",
"client_port":53293,
"client_proc":"",
"client_server":"Taruns-MacBook-Pro.local",
"count":1,
"http":{
"code":301,
"content_length":178,
"phrase":"Permanently",
"request_headers":{
"host":"cnn.com"
},
"response_headers":{
}
},
"ip":"157.166.226.25",
"method":"GET",
"params":"",
"path":"/",
"port":80,
"proc":"",
"query":"GET /",
"responsetime":104,
"server":"",
"shipper":"Taruns-MacBook-Pro.local",
"status":"OK",
"timestamp":"2015-10-01T15:47:00.519Z",
"type":"http"
}
}
Now, if we want to analyze network packets for the mysql connection then as I mentioned earlier that on mac we can monitor only one device interface using one packetbeat instance hence we would need to start another packetbeat instance for monitoring mysql traffic (device :lo0 is the change in the configuration file), on unix systems using “any” keyword in the device option of interface makes it possible to analyze data packets on all network interfaces.
interfaces:
 device: lo0
Now, packetbeat’s instance is started again after making changes in the configuration file and now it will start analyzing mysql traffic and sending json data for indexing in the ES cluster.Let’s look at one of document indexed Elasticsearch.
{"_index": "packetbeat-2015.10.01",
 "_type": "mysql",
 "_id": "AVAlD_IdtouTb4teCHYB",
 "_score": 1,
 "_source": {
 "bytes_in": 51,
 "bytes_out": 52,
 "client_ip": "127.0.0.1",
 "client_port": 60083,
 "client_proc": "",
 "client_server": "taruns-mbp.home",
 "count": 1,
 "ip": "127.0.0.1",
 "method": "UPDATE",
 "mysql": {
 "affected_rows": 1,
 "error_code": 0,
 "error_message": "",
 "insert_id": 0,
 "iserror": false,
 "num_fields": 0,
 "num_rows": 0
 },
 "path": "",
 "port": 3306,
 "proc": "",
 "query": "update authors set name = \"taruns\" where id =1",
 "responsetime": 2,
 "server": "taruns-mbp.home",
 "shipper": "taruns-mbp.home",
 "status": "OK",
 "timestamp": "2015-10-01T20:20:12.832Z",
 "type": "mysql"
 }
}
Now in the above document we notice we have the mysql method “Update” the “affected rows”, the complete query and “responetime” using responsetime and Kibana graphs we can clearly see the queries that took maximum amount of time during a certain duration. TopBeat TopBeat is the new addition to the Elastic’s product stack, it’s basically the visual alternative of the terminal’s top command. After downloading the zip file of the project and creating the Topbeat template, we just need to unzip it and start the executable (just make sure the that elasticsearch is running as well). Following is the sample default configuration provided in the topbeat.yml file
input:
 period: 20
 procs: [".*"]
shipper:
 name:
output:
elasticsearch:
  enabled: true
  hosts: ["localhost:9200"]
The default name of the Topbeat shipper is the hostname, the period 20 secs basically means the time period interval of collecting stats and currently we are monitoring all the processes but we can give specific processes in a comma separated manner. This project ships json data to Elasticsearch which can later be visualised using Kibana. Since it’s analogous to the top command thus it monitors the memory consumption of a process, it’s state, process’s cpu usage user space, system space and start-time. Following is a document from Elasticsearch sent by Topbeat shipper.
{
"_index":"topbeat-2015.09.23",
"_type":"proc",
"_id":"AU_5ns2rNiMHwRXM6TOU",
"_score":1,
"_source":{
"count":1,
"proc.cpu":{
"user":9620,
"user_p":0.04,
"system":4504,
"total":14124,
"start_time":"10:48"
},
"proc.mem":{
"size":1635956,
"rss":163396,
"rss_p":0.97,
"share":0
},
"proc.name":"Microsoft Word",
"proc.pid":14436,
"proc.ppid":1,
"proc.state":"running",
"shipper":"Taruns-MacBook-Pro.local",
"timestamp":"2015-09-23T09:52:57.283Z",
"type":"proc"
}
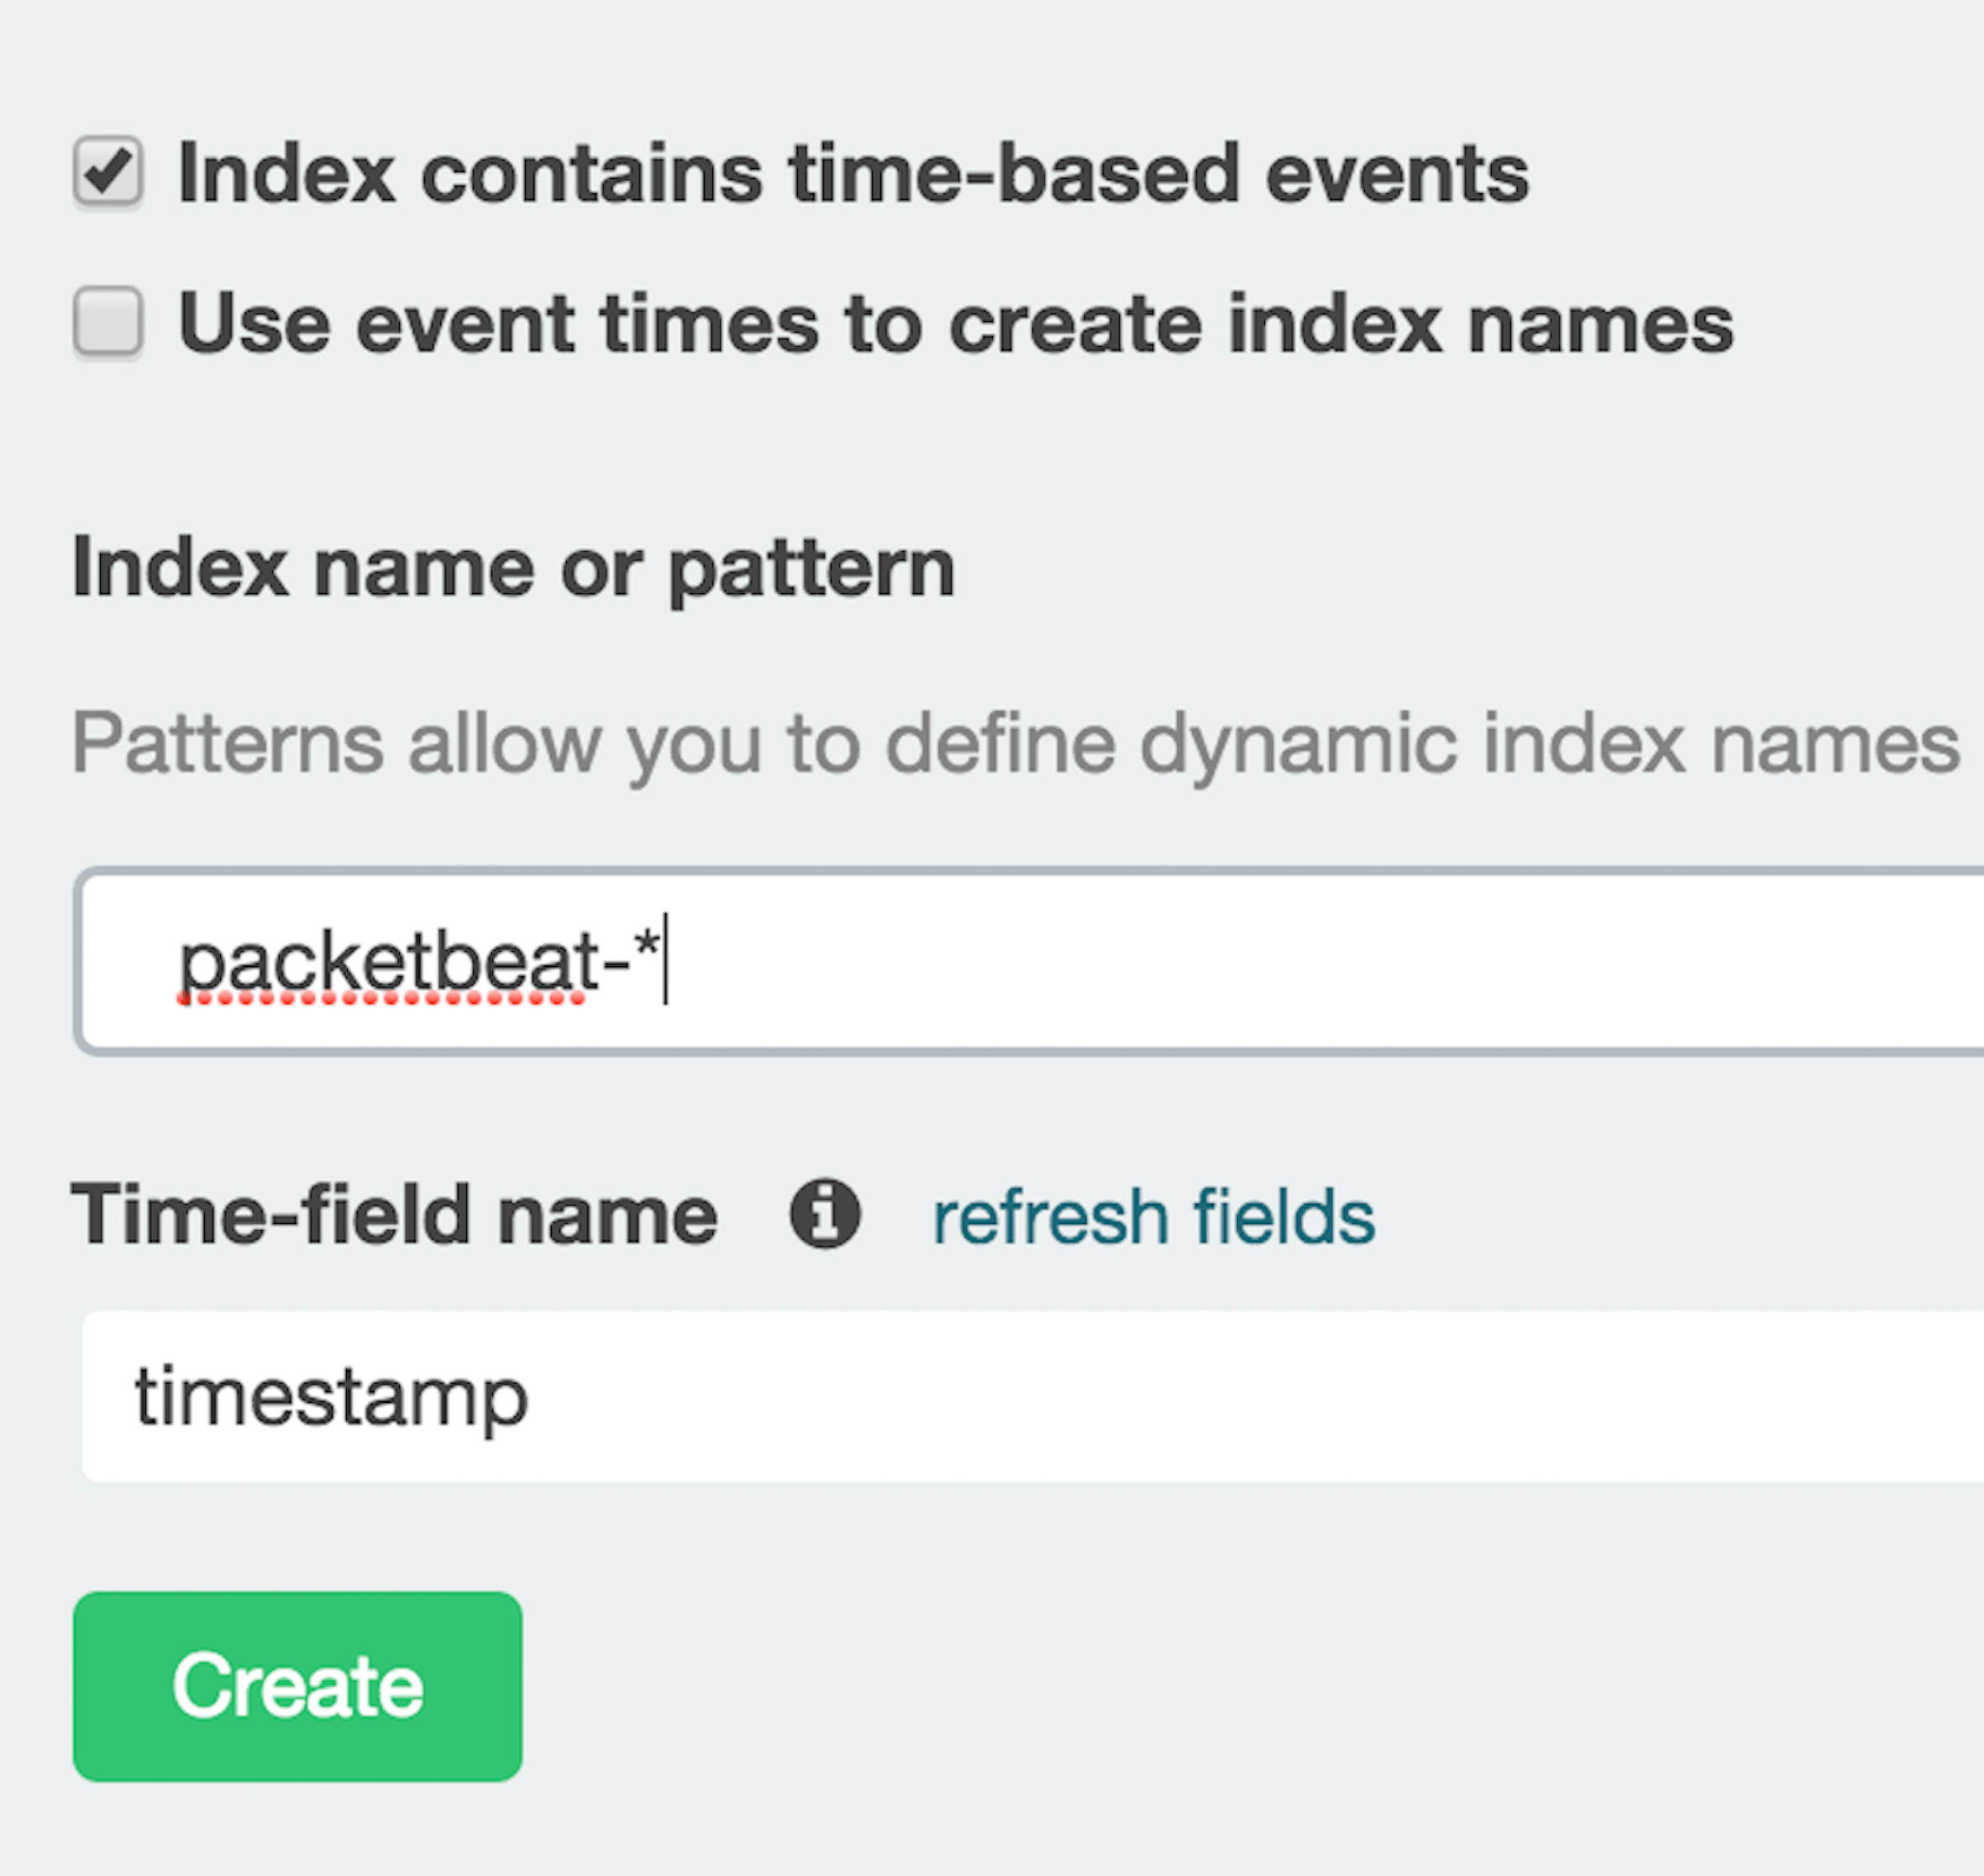
}The name of the index(if not provide) is topbeat-YYYY.MM.DD. So in the above document we can see that the proc.name as “Microsoft Word” , the process id, the parent process id. The start time, the process’ cpu stats i.e. user space and system space and the memory stats i.e. virtual memory, resident memory(rss) (and percentage) and the total memory. In case of Topbeat as well we are writing the shipper output to Elasticsearch, we can also use Redis and File system just as in Packetbeat. Since I am using my local machine for the blog, but in production environments, you would be having indexes generated on a daily basis and since Elasticsearch provides excellent cluster support thus scaling shouldn’t be a problem. Let’s now create some visualizations using Kibana, I am assuming you have basic Kibana understanding, in case you don’t know much about it, you can always read the official docs. We first need to add both the indexes in Kibana (settings section) –
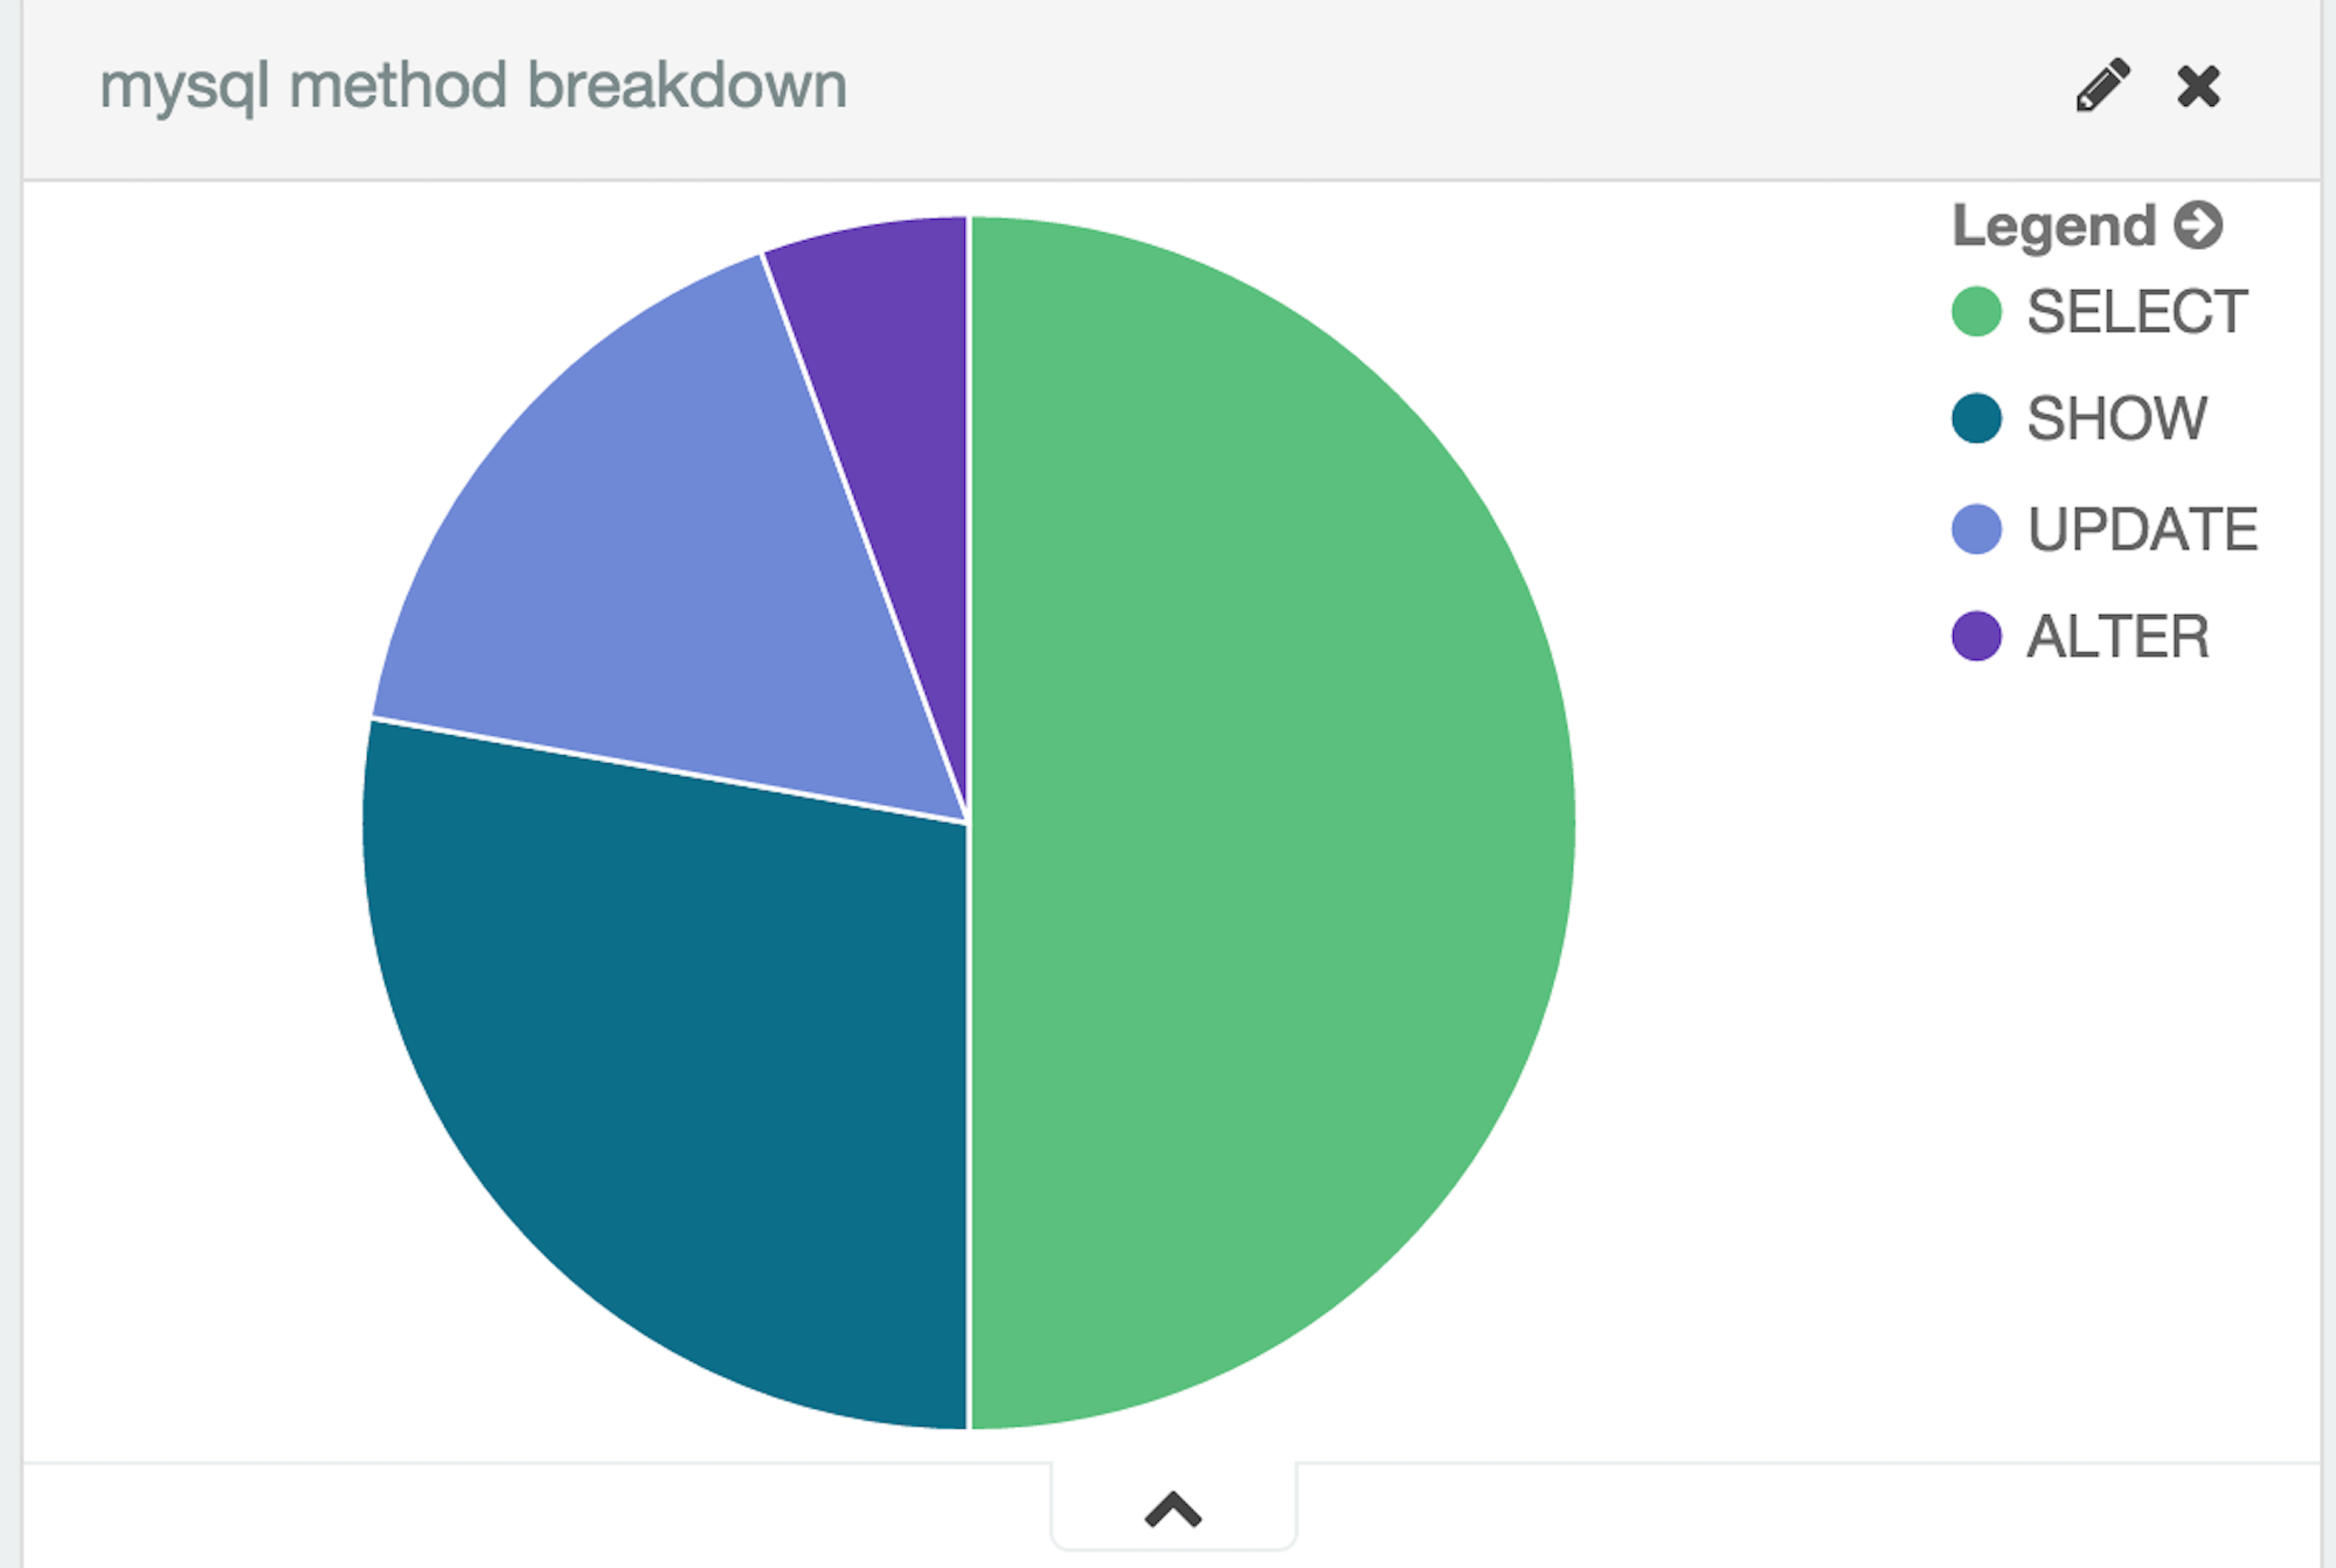
Mysql method breakdown –
Http response code overview –
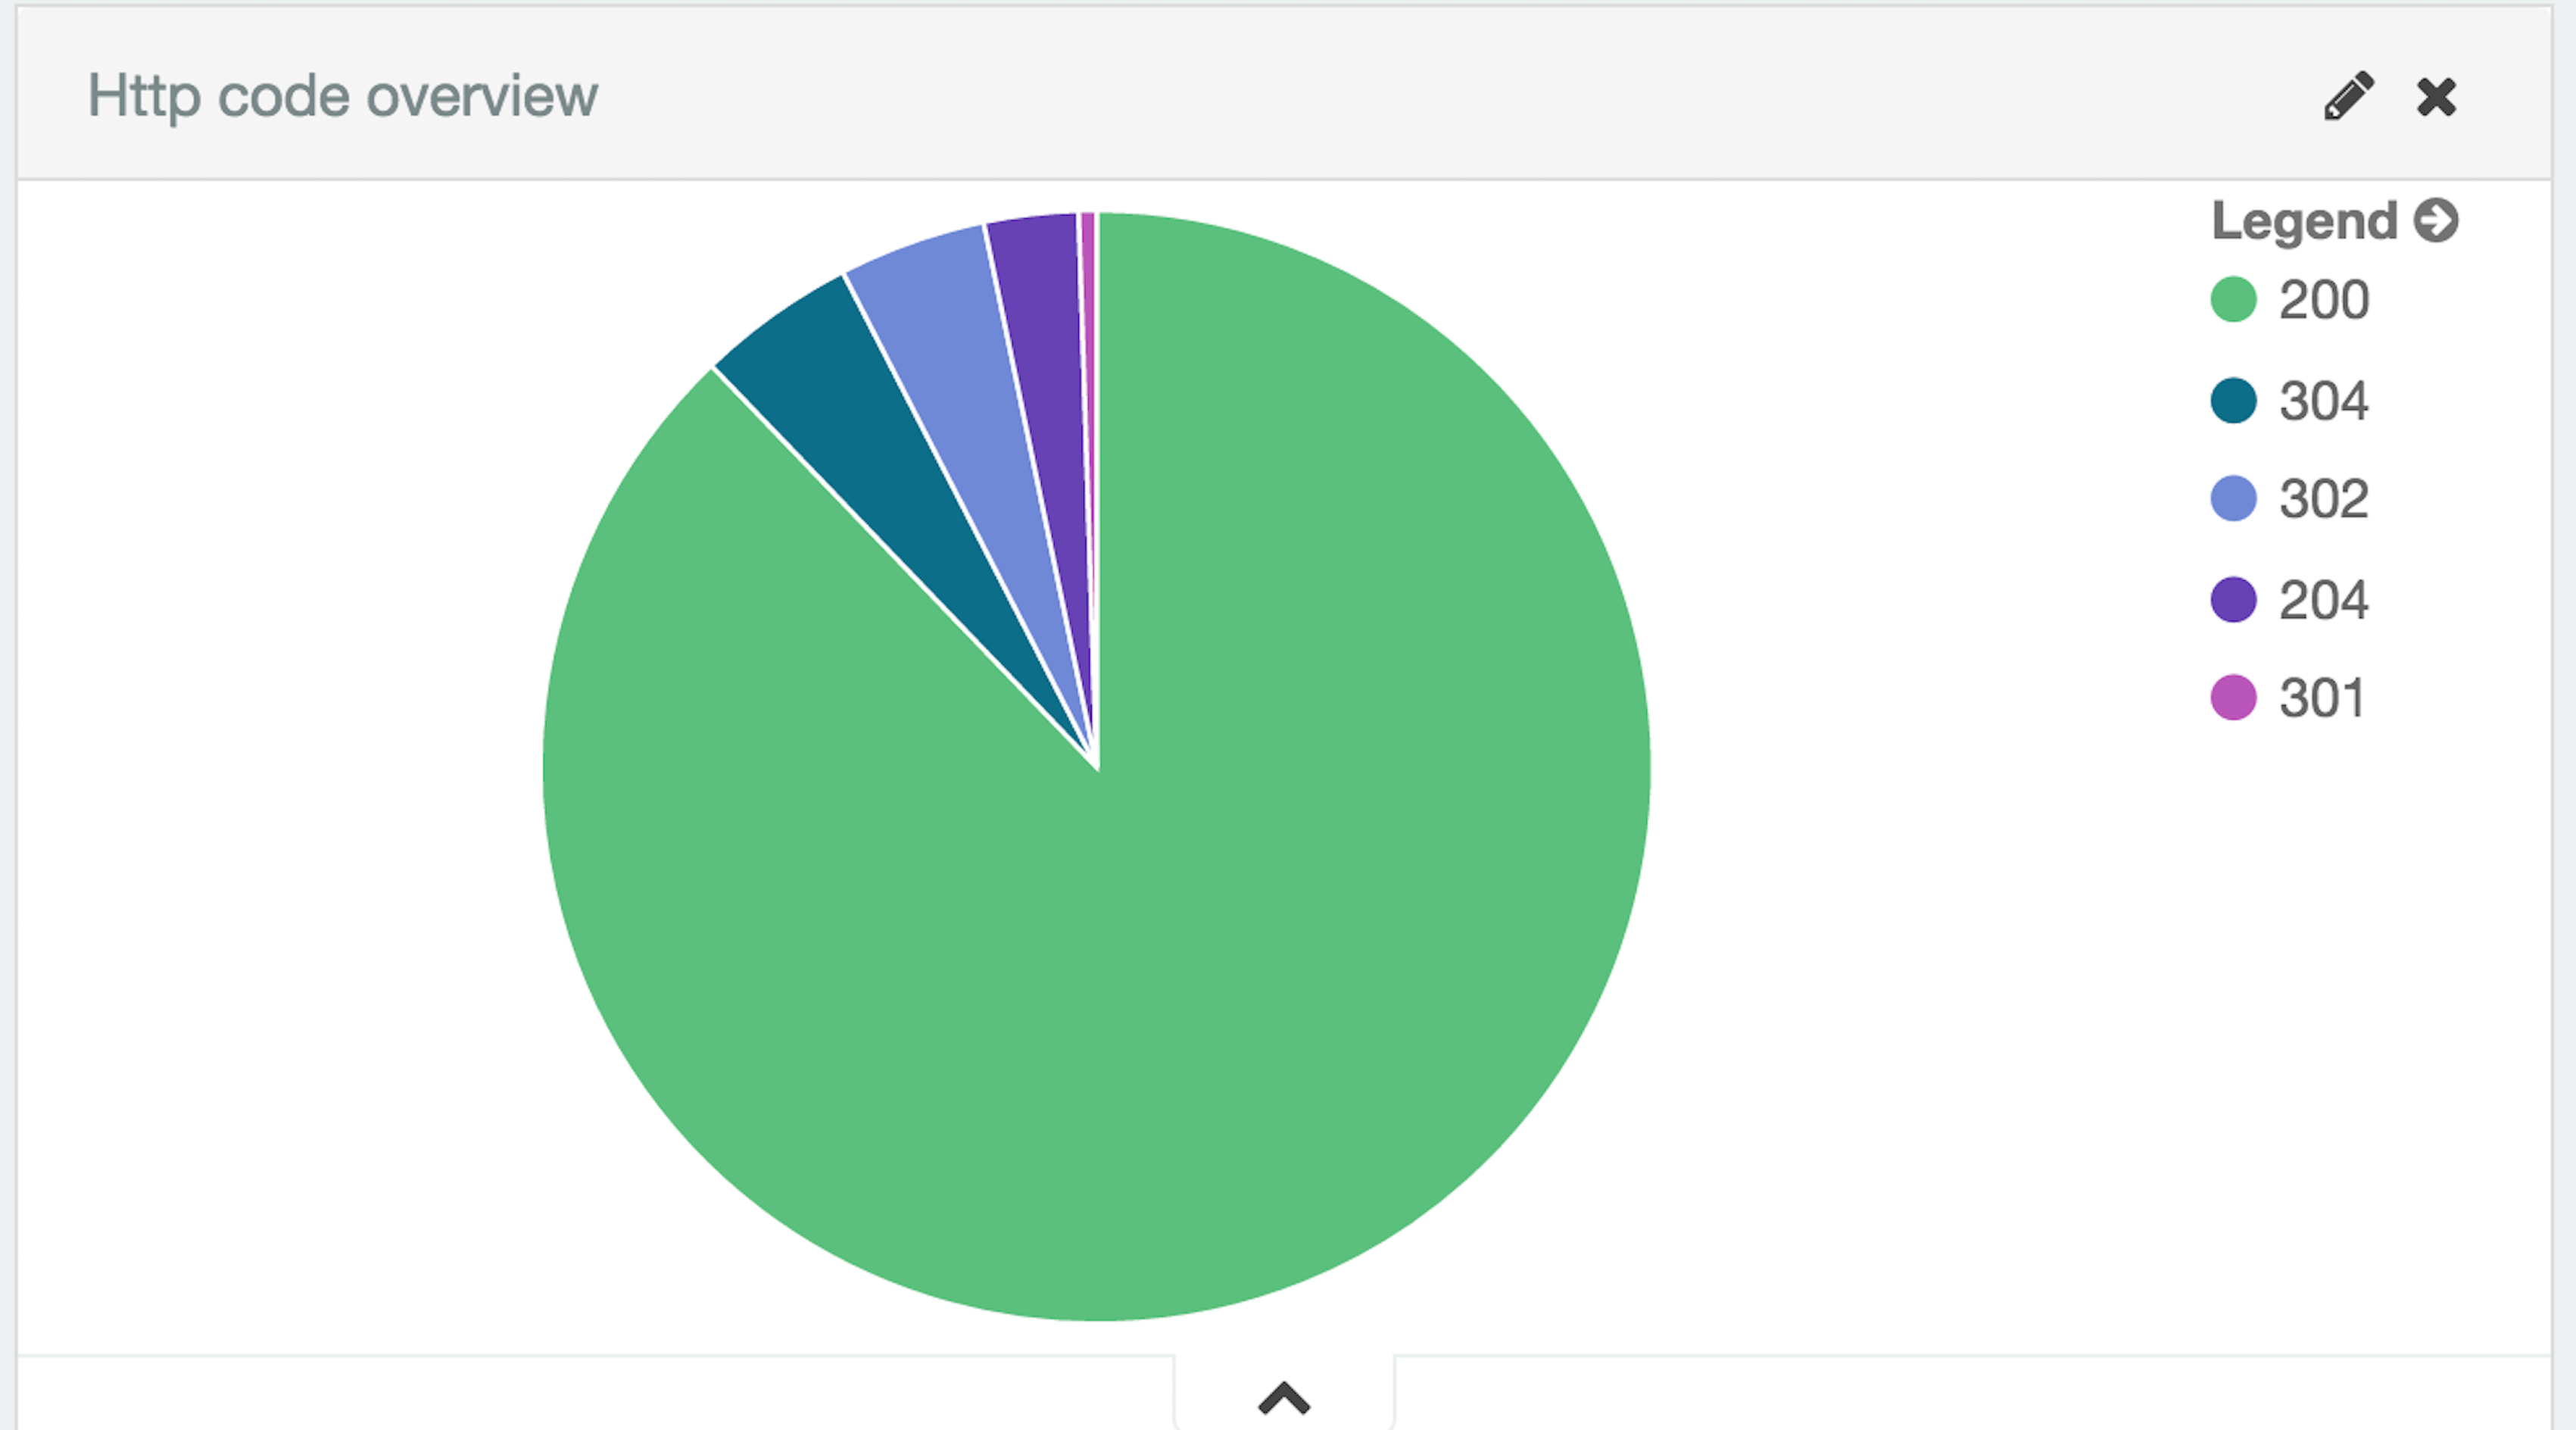
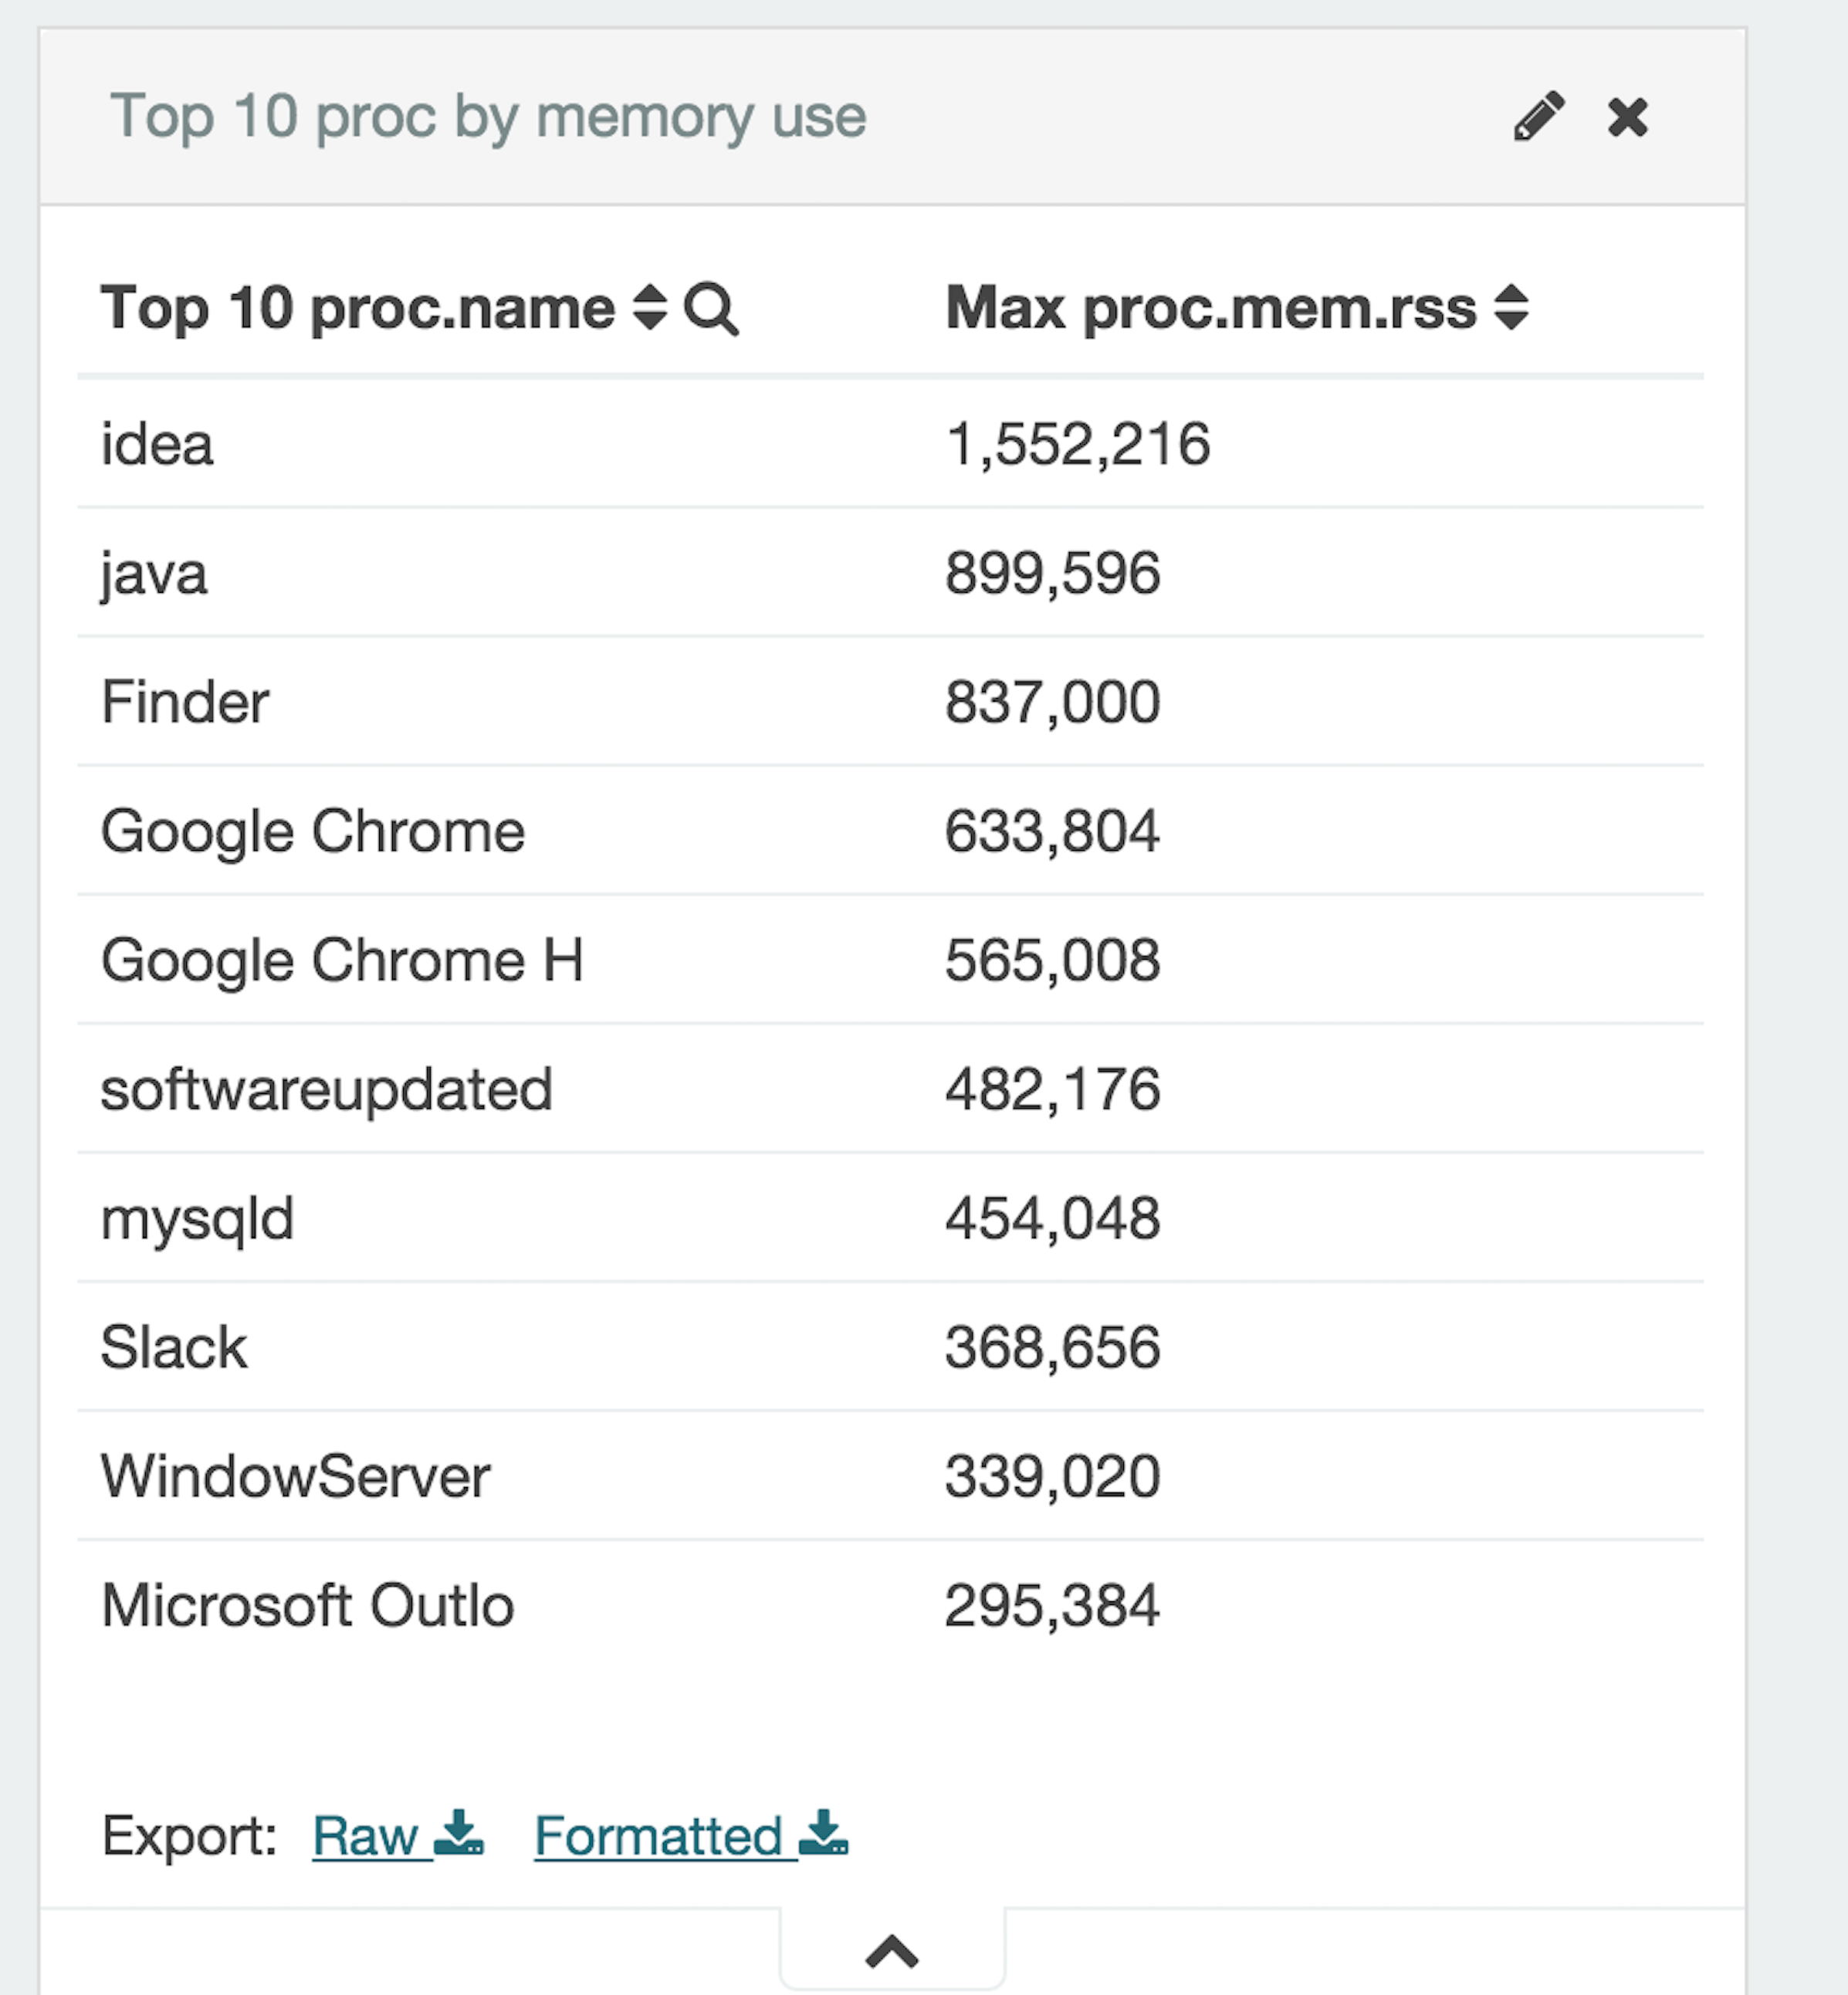
We can further use sub-aggregations to find reponsetime for each code, domains visited etc. i.e. we have so many fields that the possibilities are pretty much endless when it comes to creating various charts based on fields available to us for each indexes. Similarly, for the Topbeat indexes we have lot of possibilities, on of it being top 10 process based on resident memory consumption.
All the visualizations can then be added onto a real-time dashboard based on “last 24 hour” condition thus we could easily have an overview of last 24 hours of activity. Conclusion – We have looked at Packetbeat and Topbeat, two products which when used with ElasticSearch and Kibana can help generate some fantastic real-time Dashboard and give us insights into our Infrastructure.